
Project develops new process for illustrating planning scenarios
More attractive streetscapes often lead to an increase in private development, but it can be difficult to visualize future results when they are just potential.
An OTREC Small Starts research project has developed a workflow to create streetscape illustrations for Metro, the regional government for the Portland, Ore. metropolitan area.
Data-driven illustrations that depict planning scenarios are an effective way to communicate to decision makers the results that their investment could bring about. In line with the Oregon Legislature’s greenhouse gas reduction targets, Metro launched the Climate Smart Communities Scenarios Project in 2011.
As part of this project, Metro has developed investment scenarios designed to reduce light vehicle carbon emissions. These scenarios represent potential improvements to urban centers, corridors and employment areas. Improvements such as providing services and shopping near where people live, expanding transit service, managing parking, and providing safer routes for walking and biking can increase transit ridership, support more active travel modes, and thereby reduce pollution.
Principal Investigator Nancy Cheng of the University of Oregon worked with Metro to create a streamlined process for illustrating the scenarios.
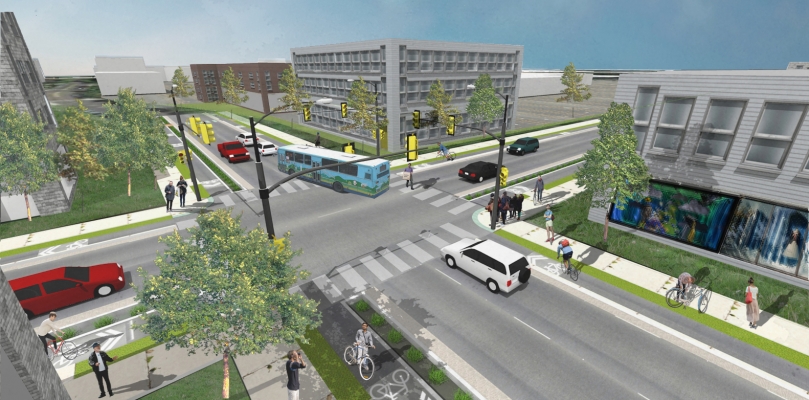
Using a streamlined workflow allows different designers to generate illustrations with a consistent graphic style. This makes the pertinent changes stand out, rather than the graphics themselves distracting from actual differences between scenarios.
Cheng, along with a team of students and graduates from the University of Oregon, identified some of the challenges and opportunities involved in creating this workflow. The team explored ways to connect planning forecasts to a parametric urban modeler. They used ESRI ArcGIS, ESRI CityEngine, Sketchup and Python scripting to create a pipeline for 3D graphic renderings of urban development possibilities.
The illustrations generated using this workflow can be adjusted according to evolving forecasts. The project team researched several ways to create visualizations and illustrations that could be updated and adjusted to reveal alternative development possibilities.
One of the most significant challenges facing the team was how to simplify vast amounts of information into a straightforward and clear picture of analysis results. Making meaningful illustrations out of planning forecasts requires an understanding of audience; different stakeholders would likely respond better to different types of visualizations. For example, a mayor might want to look at new development from an aerial view, providing a quick grasp of the complete implications of development on a city level, while a small-business owner might want to see what that development means in terms of modified access to the street or public transportation.
Cheng's background has primarily centered on architectural design, and this was her first foray into regional planning.
"I was really happy to have the opportunity to work with planners, communication and GIS [geographic information systems] specialists at Metro. Basically they are interested in the same thing we are, which is to visualize our environment and communicate the plans and visions for the alternative futures," Cheng said. "It was a great chance to understand what are the issues in bridging between our disciplines and how much we could learn from each other. We had a good rapport between team members... that for me was the greatest value: how we could understand each other’s worlds and build bridges between those worlds."
Cheng and her project team explored the strengths and weaknesses of each software and identified goals for future research in the area. For a comprehensive look at the graphic processes and challenges involved in this project, click here to visit the project page or download the final report.