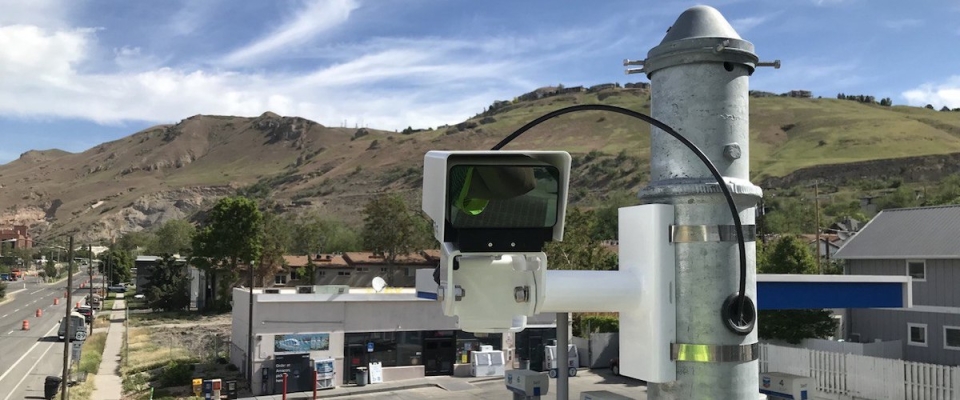
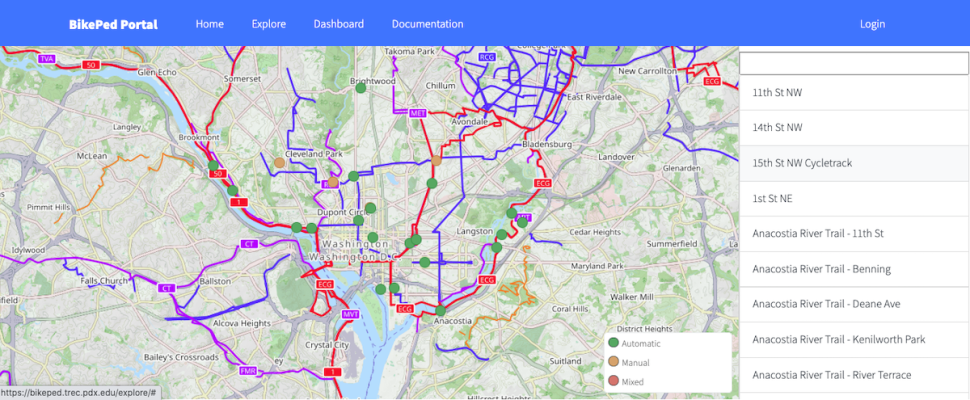
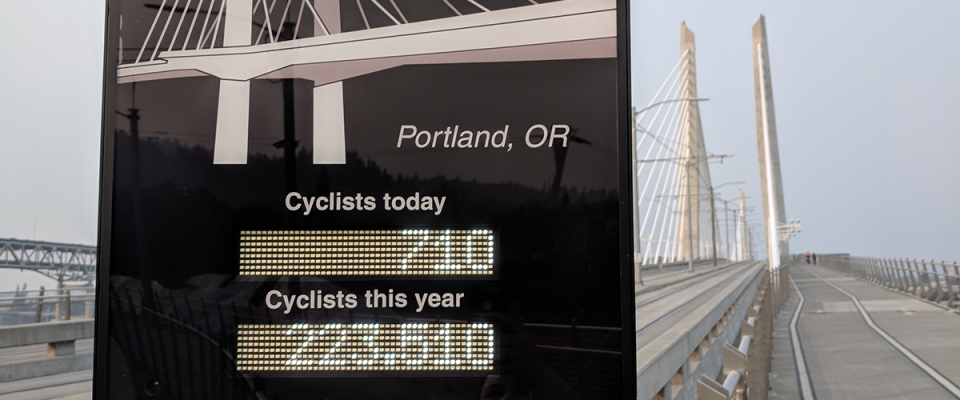
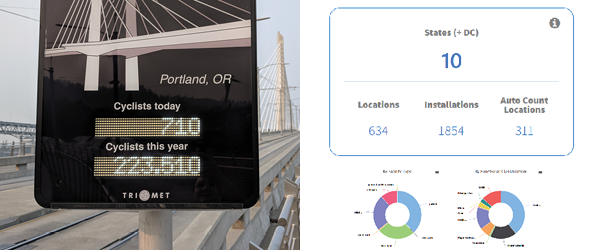
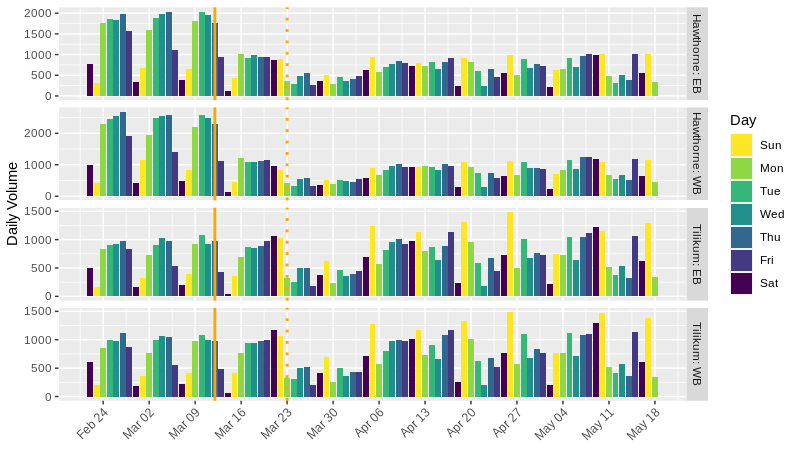
Portland State University's Transportation Research and Education Center (TREC) maintains two large, public transportation data lakes: PORTAL and BikePed Portal. The latest round of funding for PORTAL, in the amount of $1.6 million, was awarded in February 2024 and will cover PORTAL's activities through the next five years. BikePed Portal, too, recently received $100K for another year of funding, and both are the focus of some exciting innovations in transportation data.

The two centralized data repositories, unique both in their size and in the fact that they are accessible (PORTAL is freely available to the public, and BikePed Portal has limited public access as well), are supported by multiple federal, state, and regional agencies. Federal funding for PORTAL comes from the Federal Highway Administration (FHWA)'s Surface Transportation Block Grant (STBG) funding, suballocated by Metro’s ...

Read more

Pedestrian safety is critical to improving walkability in cities. To that end, NITC researchers have developed a system for collecting pedestrian behavior data using LiDAR sensors. Tested at two intersections in Texas and soon to be tested at another in Salt Lake City, Utah, the new software created by a multi-university research team is able to reliably observe pedestrian behavior and can help reduce conflicts between pedestrians and vehicles at signalized intersections. The Utah Department of Transportation (UDOT) is already working on implementing this new system to improve data collection at intersections.

Learn more in a free webinar May 18. 

The LiDAR system can especially improve multimodal travel at intersections with permissive left turns, which are indicated by a flashing yellow arrow. Previous research has shown that where a flashing yellow arrow, or FYA, is present, cars searching for a gap in traffic may not look for pedestrians. To remove the risk to people walking, some signals are programmed to turn off the FYA when a walk button is pushed. But...

Read more

In a big step forward for nonmotorized planning, a dashboard with bike data from the Washington, D.C. metro area is coming to BikePed Portal. Previously, a planner looking to see the latest biking numbers for the nation's capital would have to look at info from several jurisdictions, including Arlington County, the City of Alexandria, the District Department of Transportation, Fairfax County, Montgomery County, and the National Park Service, which manages counters on several trails and natural areas in the greater metro area.

Now, with funding from a National Park Service (NPS) Cooperative Ecosystem Studies Unit (CESU), a unique program that facilitates partnerships between federal and non-federal entities and research institutions, Virginia Tech and the University of North Carolina Highway Safety Research Center (HSRC) are teaming up with data specialists at Portland State University (PSU) to create a new dashboard that will allow users to see all the D.C. bike data together in one place.

Housed at PSU's Transportation Research and Education Center (TREC), BikePed Portal...

Read more

Travel time reliability – or the consistency and dependability of travel times from day to day, and at different times of day – is a key metric that significantly affects people’s travel behavior. Since businesses rely heavily on transportation systems, an unreliable transportation network can also impact the economic competitiveness of urban areas. As such, reliable travel times are important for transportation agencies to promote economic stability within a community. Having accurate methods to evaluate reliability is important for both transportation practitioners and researchers.

A new report from Portland State University offers an improved method for determining the confidence interval of travel time reliability metrics. Researchers Avinash Unnikrishnan, Subhash Kochar and Miguel Figliozzi of PSU’s Maseeh College of Engineering and Computer Science used a highway corridor in Portland, Oregon as a case study to evaluate their method, and found that it compared favorably with other methods of evaluating the confidence interval of travel time reliability metrics.

"Traffic engineers can apply this method to come up with a range of estimates for the unknown true travel time reliability metric. The travel time reliability metrics calculated by traffic engineers and transportation planners will have variability due to factors such as road...

Read more

In order to make sure bicyclists' needs are considered when improving a transportation system, planners and engineers need to know how many people are biking, and where. 

Traditional bicycle counters can provide data for limited sections of the bike network; often these counters are installed at important locations like trails or bridges. While limited in location, they count everyone who bikes by. Meanwhile, GPS & mobile data cover the entire transportation network, but that data only represents those travelers who are using smartphones or GPS. Combining the traditional location-based data sources with this new, crowdsourced data could offer better accuracy than any could provide alone. 

"Knowing how many people are bicycling on a street is really important for a number of reasons. As just a few examples, bicycle volumes give you a way to understand safety data and determine crash rates. They provide insight into where and how bicycle trips are taking place, which can help plan for new or improved facilities," said Nathan McNeil of Portland State University.

Supported by a pooled fund grant administered by the National Institute for Transportation and Communities (NITC), Dr. Sirisha Kothuri of Portland State University led a research project aimed at fusing traditional and...

Read more

Led by Xiaoyue Cathy Liu of the University of Utah (UU) and funded by the National Institute for Transportation and Communities, researchers have created a web-based modeling tool (see GitHub repository built for the Utah Transit Authority) that enables U.S. transit providers to explore the impacts of changing over their systems to electric buses*. The researchers ran the model for TriMet in Portland, OR as well, with TriMet results and analysis presented in the final report (PDF).

"The interactive visualization platform lets users explore various electric bus deployment budget scenarios, so that transit agencies can plan the most cost-effective way to transition their fleet from diesel to electric buses – while prioritizing disadvantaged populations," Liu said.

The research team, at University of Utah, Portland State University (PSU), and University of California, Riverside, set out to answer three questions: 

  1. What costs and benefits are associated...
Read more

A national non-motorized count data archive, BikePed Portal provides a centralized standard count database for public agencies, researchers, educators, and other curious members of the public to view and download bicycle and pedestrian count data. It includes automated and manual counts from across the country, and supports screenline and turning movement counts.

BikePed Portal was established in 2015 by Transportation Research and Education Center (TREC) researchers at Portland State University through a pooled fund grant administered by the National Institute for Transportation and Communities (NITC). Other project partners include the Federal Highway Administration, Oregon Department of Transportation, Metro, Lane Council of Governments, Central Lane MPO, Bend MPO, Mid Willamette Valley Council of Governments, Rogue Valley Council of Governments, City of Boulder, City of Austin, Cycle Oregon, and Oregon Community Foundation.

Read more
TREC awards for 2017, 2018 and 2019 bike to work month

Authored by Tammy Lee, Transportation Data Manager, Portland State University

Traditionally, the month of May is Bike to Work Month. Last year this time, Oregon logged 179,177 trips for a total of 1,374,835 miles by 10,397 riders. And last year this time TREC was winning the PSU bike to work month department challenge. So what are we seeing in the data now?

For continuity from the last time we posted some bike volume observations, we’re again showing data from the Hawthorne Bridge and Tilikum Crossing (Figure 1) in Portland, Oregon. At the moment, daily volume across the Hawthorne Bridge remains relatively low. Typically we’d expect bike volumes across the Hawthorne would be higher in May, especially because if this were “normal” times we’d be competing in the Bike to Work Month challenge. Bike volumes across the Tilikum show higher volumes beginning in April, especially on the weekends since the March 23, stay-at-home order was issued.

...

Read more
Cyclist stands next to the Hawthorne Bridge Bicycle Counter

Authored by Tammy Lee, Transportation Data Manager, Portland State University

For a deeper dive into bicycle volume data, watch the May 8 seminar with Tammy Lee and Kristin Tufte: Creating And Using A Publicly Available Multimodal Transportation Data Archive. Also, check out her earlier blog post on motor vehicle traffic volumes.

The weather these past few weeks has been beautiful: sunny, not too hot, not too cold, cherry trees blossoming… the ideal biking weather marred by a less than ideal pandemic.

Are social distancing measures affecting bike trips in Portland, OR? Maybe. Personally? Yes.

First, let’s get a few things out of the way before we provide summary observations:

  • Analyzing bike data is not as “easy” as evaluating vehicle traffic data: the infrastructure for monitoring bike (and pedestrian) data isn’t anywhere close to how vehicle traffic is monitored. There just aren’t many bicycle count detectors. So if one detector stops working then what little data that was available in the first place became that much littler.

  • ...
Read more
Cars on the freeway
Authored by Tammy Lee, Transportation Data Manager, Portland State University

For a deeper dive into vehicle volume data, attend the May 8 online seminar with Tammy Lee and Kristin Tufte: Creating And Using A Publicly Available Multimodal Transportation Data Archive. At this seminar, the presenters will offer an updated data analysis that reflects the latest vehicles volumes.

Ask most Portland drivers and they’ll tell you that traffic has gotten worse over the past 10 years. And data from the Oregon Department of Transportation supports that feeling.  

But for now, temporarily at least, all that is in the past.

The first confirmed case of COVID-19 in Oregon was February 28; a little over a month after the first positive test in the US. Since that week, many have noticed differences in traffic on our streets. An analysis of data from PORTAL - our multi-modal transportation data archive for the Portland-Vancouver metropolitan region - reflects that drop in traffic. 

A number of articles have been published describing the effects of social distancing policies in...

Read more

Pages