
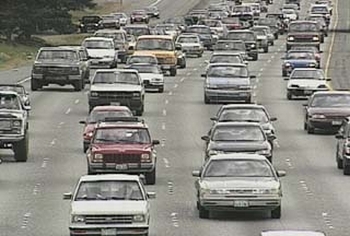
Every day, trucks travel in, out and through Portland delivering the goods that make the city and region’s economy thrive. But urban freight traffic in the Portland metro area has become increasingly congested and unreliable, leading to longer travel times, fewer goods being distributed and more greenhouse gases being emitted. OTREC researchers have worked with commercial vehicle GPS data and freeway traffic sensor data to understand the impact of urban congestion on commercial vehicle fleets and what can be done to reduce congestion.
In “Algorithms to Quantify the Impacts of Congestion on Time-Dependent Real-World Urban Freight Distribution Networks” (Read Paper Here) and “The Impacts of Congestion on Time-definitive Urban Freight Distribution Networks CO2 Emission Levels” (Read Paper Here), OTREC researcher Miguel Figliozzi and his team attempted to quantify and measure the impacts of congestion on freight from a business, as well as environmental perspective. The project team combined time-dependent algorithms, real-world traffic data, and open source software Google Maps to...
Watch video
View Nicholas Stoll's presentation slides
View Nicholas Kobel's presentation slides
Nicholas Stoll, Graduate Research Assistant, Portland State University
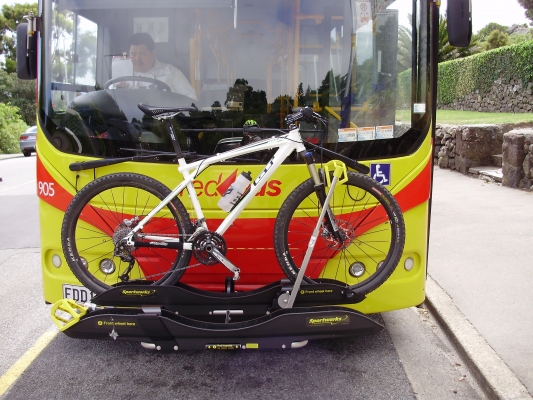
Topic: Utilizing High Resolution Bus GPS Data to Visualize and Identify Congestion Hot-spots in Urban Arterials
The research uses high resolution bus data to examine sources of delay on urban arterials. A set of tools were created to help visualize trends in bus behavior and movement, which allowed for larger traffic trends to be visualized along urban corridors and urban streets. By using buses as probes and examining aggregated bus behavior, contoured speed plots were used to understand the behavior of roadways outside the zone of influence of bus stops. These speed plots can be utilized to discover trends and travel patterns with only a few days’ worth of data. Congestion and speed variation can be viewed by time of day and plots can help indicate delays caused by intersections, crosswalks, or bus stops.
This type of information is important to transit authorities looking to improve bus running times and reliability. Congested areas can be detected and ranked. Speed plots...
Read more