
How the Pandemic Broke TREC’s “Bike to Work Month” Winning Streak
Authored by Tammy Lee, Transportation Data Manager, Portland State University
Traditionally, the month of May is Bike to Work Month. Last year this time, Oregon logged 179,177 trips for a total of 1,374,835 miles by 10,397 riders. And last year this time TREC was winning the PSU bike to work month department challenge. So what are we seeing in the data now?
For continuity from the last time we posted some bike volume observations, we’re again showing data from the Hawthorne Bridge and Tilikum Crossing (Figure 1) in Portland, Oregon. At the moment, daily volume across the Hawthorne Bridge remains relatively low. Typically we’d expect bike volumes across the Hawthorne would be higher in May, especially because if this were “normal” times we’d be competing in the Bike to Work Month challenge. Bike volumes across the Tilikum show higher volumes beginning in April, especially on the weekends since the March 23, stay-at-home order was issued.
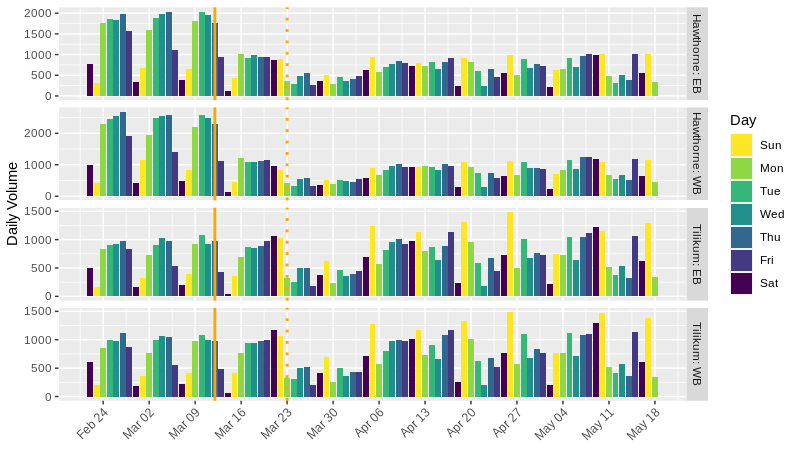
Figure 1. Daily bike volumes across Hawthorne Bridge and Tilikum Crossing. EB = eastbound; WB = westbound. The solid orange line (March 12) represents the closing of schools; the dotted orange line (March 23) represents the “stay-at-home” announcement.
Perhaps the difference in bike volume trends between the two bridges can be attributed to the type of facility and location. Hawthorne Bridge is a main thoroughfare into downtown Portland, and the Tilikum is located by OHSU and excludes vehicular access. Personally, it’s more pleasant to ride across the Tilikum, but it’s out of the way for me if I’m biking to work. If most people probably aren’t biking to work, are they biking for fitness?
Based on a brief analysis by PSU’s Dr. Jay Gopalakrishnan, one way to look at the data is to compare weekday versus weekend bike volumes. Using data from the Tilikum, we took the average 15-minute volume Monday through Friday for weekdays, and Saturday and Sunday for weekends, and compared it to pre- and post-stay-at-home. For pre-stay-at-home, we had a few years worth of data to calculate the average 15-minute bicycle volume (days with no data were excluded).
Figure 2 below shows pre-stay-at-home on the top panels, and post-stay-at-home on the bottom panels with the left panels representing average 15-minute weekday volume, and the right panels representing the average 15-minute weekend volume. What we saw:
- Pre-stay-at-home weekday there is a distinct bimodal distribution of the westbound morning commute and the eastbound evening commute.
- Pre-stay-at-home weekend there is a single afternoon bump.
- Post-stay-at-home weekday average volumes look more like the weekend.
- Post-stay at home weekends are showing higher average volumes than before.
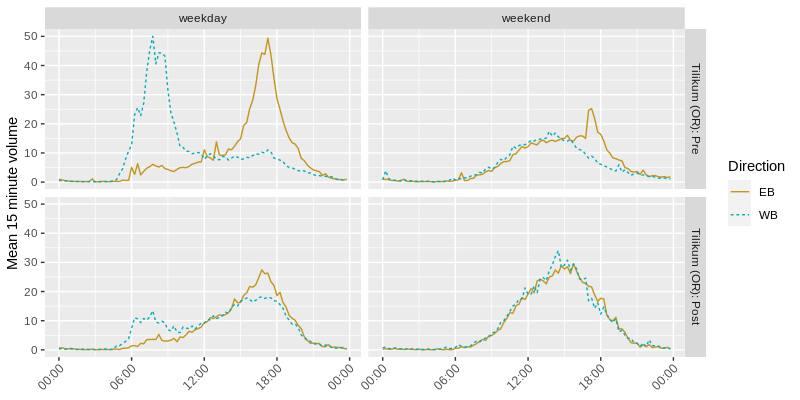
Figure 2. Average 15-minute bicycle volumes across Tilikum Crossing pre- (before March 23) and post-stay-at-home (March 23 through May 18).
Data from Tilikum suggests that people are shifting from biking for commuting to biking for recreation and fitness. How does this compare to other places? Seattle is showing similar trends across the Folsom Bridge, and a recent survey from Cascade Bicycle Club indicated that a majority of their respondents are biking at the same rate if not more since COVID-19 crisis began.
We have also noticed a similar trend in other parts of the country. Below we have included a comparison of weekday versus weekend average 15 minute bike volume for pre- and post-stay-at-home announcements for locations in Arlington, Virginia (Figure 3); and Boulder, Colorado (Figure 4). Both locations are in areas used by commuters. And in both locations there is the bimodal morning/evening peak weekday commute pre-stay-at-home that shifts to unimodal weekend pattern.
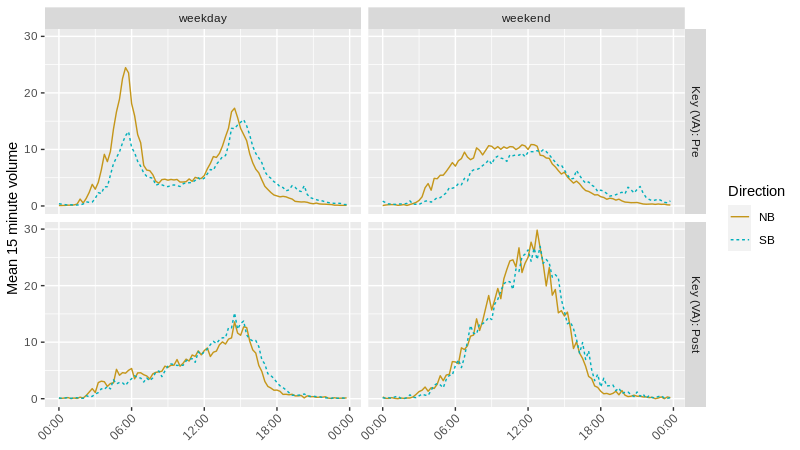
Figure 3. Key Bridge, Arlington, VA. Pre-stay-at-home before March 23; post-stay-at-home includes March 23 through May 18.
The Key Bridge (VA), linking Arlington to DC, shows more than double the weekend bike volume post-stay-at-home; however, the Folsom St (CO) location does not show an increase in average bike volume which may be because the detector is located near an entrance to the University of Colorado, Boulder, where in-person classes were cancelled on March 11, 2020.
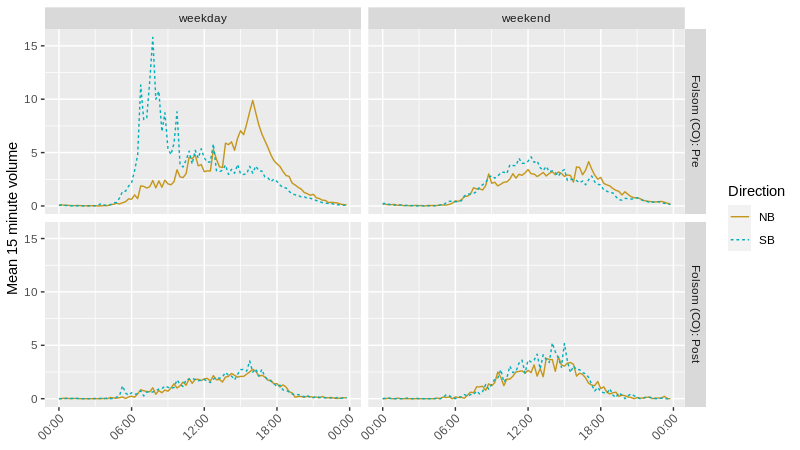
Figure 4. Location of Folsom St. south of Arapahoe Ave, Boulder, CO. Pre-stay-at home before March 19; post-stay-at-home includes March 19 through May 18.
To reiterate from our previous post, it’s a waiting game for more time-based data in order to get a clearer picture of how COVID-19 related social and economic policies affect bicycle travel in the U.S.
ABOUT THE AUTHOR
 Tammy Lee, Ph.D.
Transportation Data Program Administrator
Tammy is working on a variety of projects for TREC, including documentation, data synthesis, analysis, and visualization supporting ongoing work with PORTAL and Bike-Ped Portal. Prior to joining TREC, she worked as a data scientist for a political digital media consulting firm.
The Transportation Research and Education Center (TREC) at Portland State University is home to the National Institute for Transportation and Communities (NITC), the Initiative for Bicycle and Pedestrian Innovation (IBPI), and other transportation programs. TREC produces research and tools for transportation decision makers, develops K-12 curriculum to expand the diversity and capacity of the workforce, and engages students and professionals through education. For resources and tools for remote teaching during the quarantine period, check out our TREC and COVID-19 resource page.