
For transportation planners and engineers, the problem is visible every day: the sidewalk that ends abruptly in the grass, the bike lane that vanishes at a dangerous intersection, or the neighborhood cut off from a nearby park by a highway. These are gaps in the active transportation network. While the need to fix them is obvious, quantifying the benefits to justify the funding has historically been a stumbling block.
A newly published report, Estimating Benefits of Closing Gaps in Active Transportation Networks: A Guide, aims to solve this problem.
Developed by a research team led by Alta Planning + Design, in partnership with Portland State University (PSU), Safe Streets Research + Consulting, and Cambridge Systematics, the guide provides a comprehensive framework for agencies to estimate the economic, health, and social benefits of connecting their communities. The research was funded by the National Cooperative Highway Research Program (NCHRP). Mike Sellinger of Alta Planning + Design's Portland office, and a PSU alum, was the project's principal investigator, and the PSU team members were Joe Broach and Jennifer Dill. This project involved extensive analysis and subject matter expertise to develop and test the methods outlined in the guide by Alta’s Civic Analytics team, including primary research advisor David Wasserman and PSU alum Kim Voros.
A Guide For Agencies Of All Sizes
One of the most significant hurdles for smaller agencies is a lack of baseline data. How do you estimate the number of people who will walk on a sidewalk that doesn’t exist, or bike on a road currently deemed too dangerous for travel?
"We focused on making this guide come with the 'batteries included,'" said Joe Broach of PSU. "It walks you through all kinds of different ways at different capacity levels to estimate the behavior shift... so that someone could come with almost nothing, with just an idea of their locality and a project, and come out with some pretty defensible estimations of the benefits."
For projects on high-stress roadways where no one is currently walking or biking—and therefore no baseline count data exists—the guide provides a "Context Transfer" process. This allows planners to estimate future activity based on similar facilities in similar contexts, rather than throwing up their hands because they lack local data. “This process enables context sensitive estimates of demand when there is a qualitative match where a facility with counts exists and can be used to inform estimates on a future facility tomorrow. The method is also flexible in that the demand measure being used to drive this method can be a number of potential metrics ranging from modeled short trips to population density,” said David Wasserman of Alta.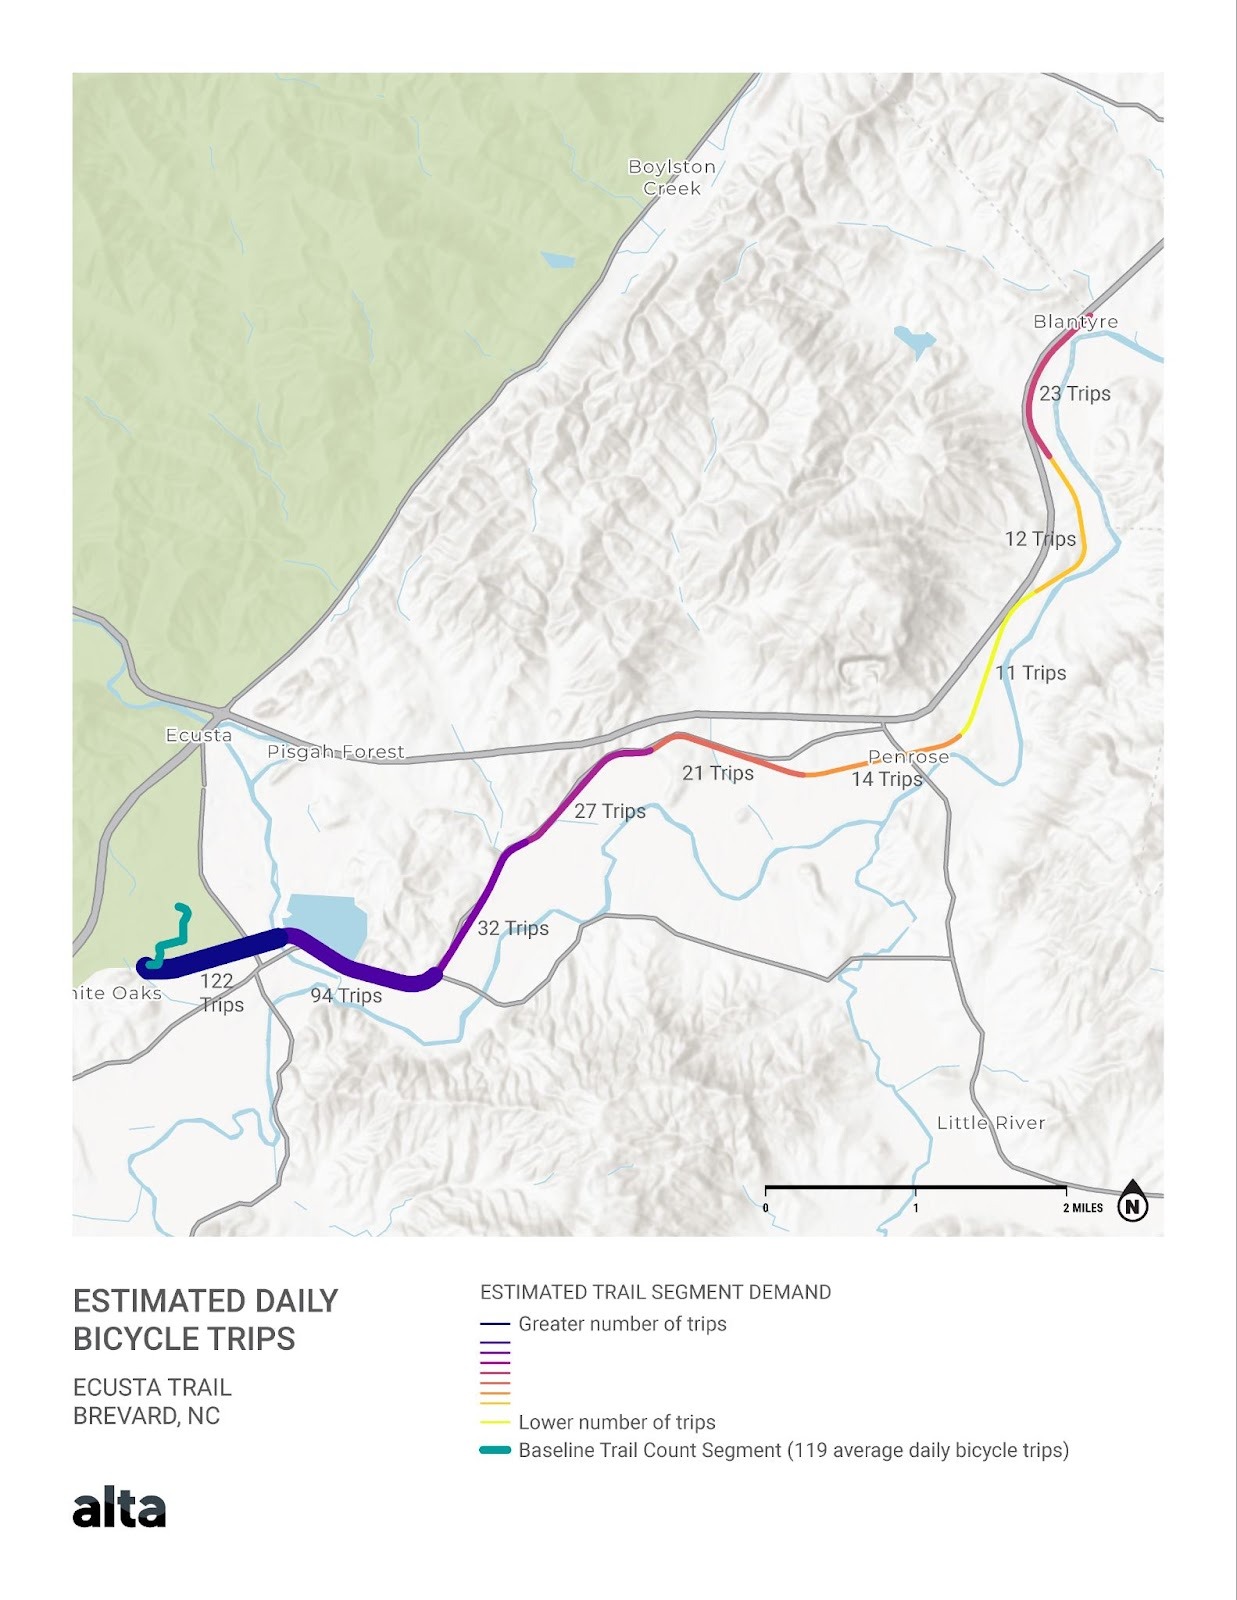
Application example of context transfer in practice for a trail in Brevard, NC. Longer trails such as this one would adjust total trips estimates based on trip distances of travelers where appropriate.
Scalable Methods: Basic, Augmented, and Advanced
A key innovation of the report is its tiered methodology, designed to be useful for agencies of all sizes—from small rural towns to major metropolitan planning organizations. The guide organizes its analytical tools into three categories:
- Basic Methods: Designed for practitioners with standard resources and time. These methods rely on national datasets and simple multipliers found within the guide itself. For example, if a city wants to estimate the safety benefits of a project but lacks local crash history data, the guide provides safety multipliers based on roadway functional class.
- Augmented Methods: Geared toward agencies with GIS capabilities and staff expertise. These methods utilize local data inputs and network analysis to refine estimates, providing a more tailored look at how a specific gap closure improves access to jobs and destinations.
- Advanced Applications: Showcasing state-of-the-art analysis using regional travel demand models and custom safety performance functions.
This structure ensures that "no one should be turned away from the guide just because they don't have a strong GIS person in-house," Broach noted.
Case Studies For Inspiration
The report also delves into case studies from the states of Utah and Oregon and the cities of Madison, WI and Portland, OR. These case studies are intended to showcase advanced methods that each of these places have developed, serving as success stories of how agencies can create their own unique approaches to assessing the benefits of closing a gap.
The Missing Link: Estimating Behavior Change
Before an agency can calculate the health or emissions benefits of a new trail, they must first answer a fundamental question: How many people will use it?
Many existing tools require the user to provide this number upfront. This guide distinguishes itself by guiding the user through the process of estimating behavior change first. The guide utilizes Level of Traffic Stress (LTS) as a primary metric, linking improvements in user comfort directly to predicted increases in walking and bicycling.
By quantifying how a project shifts travel behavior—whether by inducing new trips, shifting routes, or shifting modes from driving to active travel—agencies can then accurately calculate downstream benefits.
Measuring the Five Types of Benefits
After estimating how travel behavior might change, the guide walks you through how to calculate benefits in five areas:
- Health: Estimate how increased physical activity can reduce deaths and put a dollar value on lives saved.
- Safety: Calculate how much crashes and injuries might decrease using research-based safety factors for the specific improvements.
- Emissions: Measure how much pollution (like CO₂ and NOx) is reduced when people drive less and walk or bike more.
- Enhanced Travel Options: Put a value on smoother, more comfortable, and more direct trips for users.
- Local Economic Activity: Look at possible effects on property values, visitor spending, and local business sales.
Communicating the Results
The research team recognized that calculating benefits is only half the battle; communicating them effectively to decision-makers and the public is equally vital. Chapter 5 of the guide is dedicated to "Communicating the Results," offering strategies for tailoring data to different audiences, from federal grant reviewers to local elected officials.
"This chapter is helpful for figuring out, what do you do with this? And who's your audience? Is this for decision makers? Is this for the public? So there are some good ideas for messaging and how you talk about it to different audiences," noted Mike Sellinger of Alta Planning + Design. This section offers tips on creating infographics to show the data clearly, and on how to explain uncertainty in estimates so readers understand what the numbers mean.
A Resource for the Future
The publication of this guide marks a significant step forward in active transportation planning. By providing a flexible, scientifically grounded framework, it empowers communities to make the case for infrastructure that connects people to places.
The full report is available now through the National Academies Press.
Portland State University's Transportation Research and Education Center (TREC) is a multidisciplinary hub for all things transportation. We are home to the Initiative for Bicycle and Pedestrian Innovation (IBPI), the data programs PORTAL and BikePed Portal, the Better Block PSU program, and PSU's membership in PacTrans, the Pacific Northwest Transportation Consortium. Our continuing goal is to produce impactful research and tools for transportation decision makers, expand the diversity and capacity of the workforce, and engage students and professionals through education, seminars, and participation in research. To get updates about what's happening at TREC, sign up for our monthly newsletter or follow us on social media.

