
Photo by Cait McCusker
In our previous posts about Portland, Oregon bike travel and the pandemic from April and May, we observed bridge crossing stagnation and decline across the Hawthorne and Tilikum Crossing bridges during normal commute hours. To expand on these findings, we took a look at how Portland’s bike share system – BIKETOWN – has been impacted by the global pandemic.
Claims of a worldwide boom in bike share usage were reported during the early days of COVID-related closures. However, a few months have gone by and it’s now apparent that these findings were misleading due to limited sample selection. For example, some of the reported US bike share ridership outlooks were based on data collected over a very short period, just a week and a half in early March for Chicago and NYC. In the same article, Seattle and San Francisco were actually shown to have experienced a decrease in bike share ridership. In contrast, the Federal Bureau of Transportation Statistics (BTS), using data from March, April, and May, has actually found between a 7% and 60% overall decrease in bike share ridership across several US cities compared to 2019 levels. But what about Portland?
Unfortunately, Portland’s bike share system has not fared much differently from the rest of the country, when compared to the BTS report. Controlling for seasonal ridership trends, we fit a regression curve (R2 = 0.63, which means it accounts for 63% of the variation in the data) to all of BIKETOWN’s pre-COVID trip data, and compared it with the post-COVID closure data we have through the end of August, 2020 (Fig. 1). (Data anomaly: The spike in trips observed mid-2018 were a result of all rides being free during the May Bike to Work Challenge.)
Fig 1.: Daily observed trips since the start of BIKETOWN. Blue curve: seasonally adjusted predicted daily trips. Solid orange: schools closed (Mar 12, 2020). Dashed orange: stay-at-home order issued (Mar 23, 2020)
Looking closer at 2020 (Fig 2.):
Fig 2.: Daily observed trips, 2020 only. Blue curve: seasonally adjusted predicted daily trips. Solid orange: schools closed (Mar 12, 2020). Dashed orange: stay-at-home order issued (Mar 23, 2020)
We found that so far during the pandemic, on average, BIKETOWN ridership is down 72.7% (standard deviation 8.7%) compared to the expected ridership for that day of the year according to our model.
We were also curious to understand how this manifests spatially using rough trip origin and destination coordinates provided by BIKETOWN. We followed a similar method to An et al. (2019) for building the flow maps presented below. These maps show Portland split into census tracts, areas defined by the Census Bureau that contain similar numbers of residents. We arrange the maps to show average trip origins and destinations between and within census tracts, for three-hour intervals for dates before and after the implementation of COVID restrictions. The total average trips per day during the time period is also displayed on each map. First, looking at weekdays (Fig 3 & 4):
Fig 3. Flow maps depicting trip origins and destinations between and within census tracts for the average weekday morning, pre- and post-COVID closures.
Fig 4. Flow maps depicting trip origins and destinations between and within census tracts for the average weekday afternoon, pre- and post-COVID closures.
We notice an unmistakable drop in total trips at all hours of the day - in particular, we see a reduction in trips to and from downtown and between other census tracts during normal commute and happy hours. There is a lesser drop in trips remaining within the downtown census tracts, except during the noon to 3 PM period. Yet, the number of trips that remain within census tracts outside of downtown is similar to pre-COVID times. This tells us that riders are maintaining a similar number of trips to local destinations while reducing the number of longer-distance inter-census tract trips.
Next, let’s look at weekends (Fig 5 & 6):
Fig 5. Flow maps depicting trip origins and destinations between and within census tracts for the average weekend day morning, pre- and post-COVID closures.
Fig 6. Flow maps depicting trip origins and destinations between and within census tracts for the average weekend day evening, pre- and post-COVID closures.
Similar to weekday trips, weekend trips are also down at all hours of the day. This manifests most prominently in inter-census tract and downtown trips. Again, intra-census tract trip levels remain similar to pre-COVID times, except early in the morning and late in the evening.
Interestingly, there appear to be more trips occuring in a few new north and east census tracts compared to pre-COVID times, but this could be showing up due to added system area coverage since the initial launch of BIKETOWN. (Read more about BIKETOWN’s system area expansions in their blog posts from June 1, 2017 and May 31, 2018.) Since these areas were not originally part of the system for several years, the census tracts around the edges of the current system area have artificially lower pre-COVID average trips.
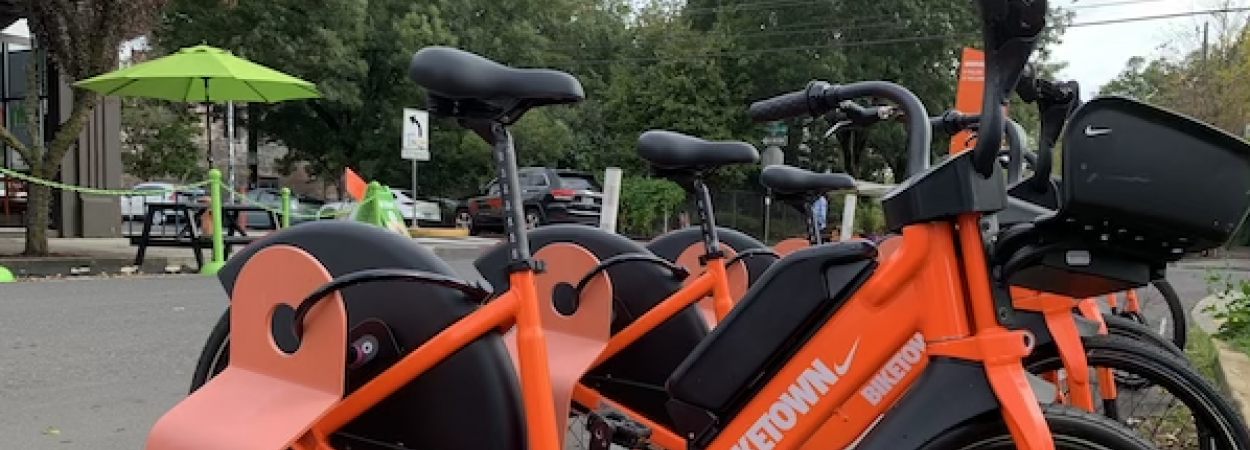
To better contextualize these results, we hope to compare Portland’s bike share trends with those in other cities soon. Additionally, it will be interesting to track how BIKETOWN ridership behavior changes as the new electrified fleet rolls out this month. Stay tuned!
LEARN MORE about Portland State University research on bike share and e-bikes.
ABOUT THE AUTHORS
Michael McQueen
Graduate Research Assistant
Mike McQueen is a second year master's student working with John MacArthur of TREC and Kelly Clifton of the Department of Civil and Environmental Engineering. Currently Mike is researching e-bike travel behavior and micromobility as an Eisenhower Fellow. In the past he has studied e-bike purchase incentive programs, potential positive environmental impact of e-bikes in Portland, BIKETOWN, and the demographics of zero car households.
Tammy Lee, Ph.D.
Transportation Data Program Administrator
Tammy is working on a variety of projects for TREC, including documentation, data synthesis, analysis, and visualization supporting ongoing work with PORTAL and Bike-Ped Portal. Prior to joining TREC, she worked as a data scientist for a political digital media consulting firm.
The Transportation Research and Education Center (TREC) at Portland State University is home to the National Institute for Transportation and Communities (NITC), the Initiative for Bicycle and Pedestrian Innovation (IBPI), and other transportation programs. TREC produces research and tools for transportation decision makers, develops K-12 curriculum to expand the diversity and capacity of the workforce, and engages students and professionals through education. For resources and tools for remote teaching during the quarantine period, check out our TREC and COVID-19 resource page.

