BikePed Portal, the national non-motorized count data archive housed at Portland State University (PSU), provides a centralized standard bicycle and pedestrian count database which includes automated and manual counts from across the country. BikePed portal, as a paid service, also offers a suite of custom tools and products – with more features being developed all the time.
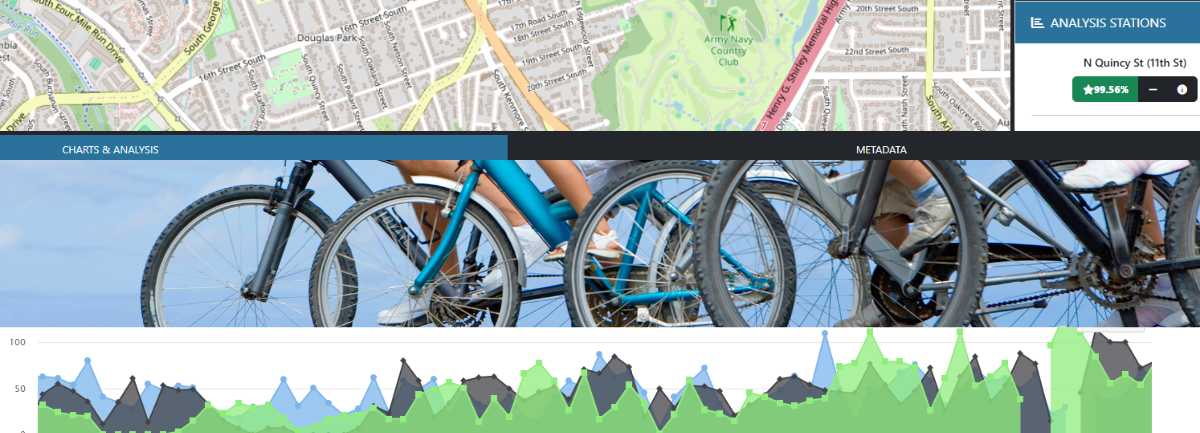
The newest feature added to BikePed Portal is Explore Plus, a robust dashboard that allows users to conduct a wide range of data analyses.