Wildlife everywhere faces a growing challenge: moving safely across an increasingly fragmented landscape. Roads, urban development, and other human-made barriers can make it harder for animals to access food, shelter, and breeding areas, while also increasing the risk of wildlife-vehicle collisions. To address this issue, researchers at Portland State University (PSU) worked on a groundbreaking effort to understand and protect the travel patterns of Oregon’s wildlife.

The Oregon Connectivity Assessment and Mapping Project (OCAMP) was a multi-year collaboration aimed at mapping wild species' habitats and travel corridors across the state. The research team created an interactive Priority Wildlife Connectivity Areas Map of Oregon, which can be used to protect wild animals' ability to move from place to place. The project was funded in part by the Oregon Department of Transportation (ODOT), to help the agency identify and mitigate the impacts of transportation infrastructure on Oregon's wildlife.

ABOUT THE PROJECT 

In June of 2019, the Oregon Legislative Assembly passed House Bill 2834, which mandated that the Oregon Department of Fish and Wildlife (ODFW) develop a Wildlife Corridor Action Plan to provide guidance for the designation and protection of wildlife corridors in Oregon. The bill also directed the Oregon Department of Transportation (ODOT) to establish a program to reduce wildlife-vehicle collisions in areas where wildlife corridors identified in the Wildlife Corridor Action Plan intersect with proposed or existing public roads. 

Rachel Wheat, the Wildlife Connectivity Coordinator for ODFW, was the project coordinator. The PSU research team was led by Martin Lafrenz of the Geography department, Catherine De Rivera of Environmental Sciences and Management, and Daniel Taylor-Rodriguez of the Department of Mathematics and Statistics. Lafrenz is a geomorphologist who studies human alteration of the water cycle and the landscape, De Rivera studies how anthropogenic changes in habitat connectivity affect animal populations and ecosystems, and Taylor-Rodriguex focuses on applying statistical methods to large scale problems, with an emphasis on ecological applications. The research was supported by PSU masters students Amanda Temple, Claire Brumbaugh-Smith, and Alana Simmons, and PhD students Leslie Bliss Ketchum and Jacob Schultz.

A large number of researchers, conservation groups, agencies and others were involved in helping to complete OCAMP – part of Oregon's larger conservation strategy – and the data used in the project came from many sources.

"A lot of biologists worked on this project, and many of them know each other. So we reached out to certain people, and then they reached out to more people. There were a lot of connections that happened, for over a year, and people supplied us with whatever data they had on animal presence or tracking," Lafrenz said. Lafrenz's team mapped out key habitats and travel routes used by different species, and Taylor-Rodriguez's team used the data to ensure that the maps aligned with real-world species movement and habitat use.

CONNECTING SCIENCE TO TRANSPORTATION SOLUTIONS

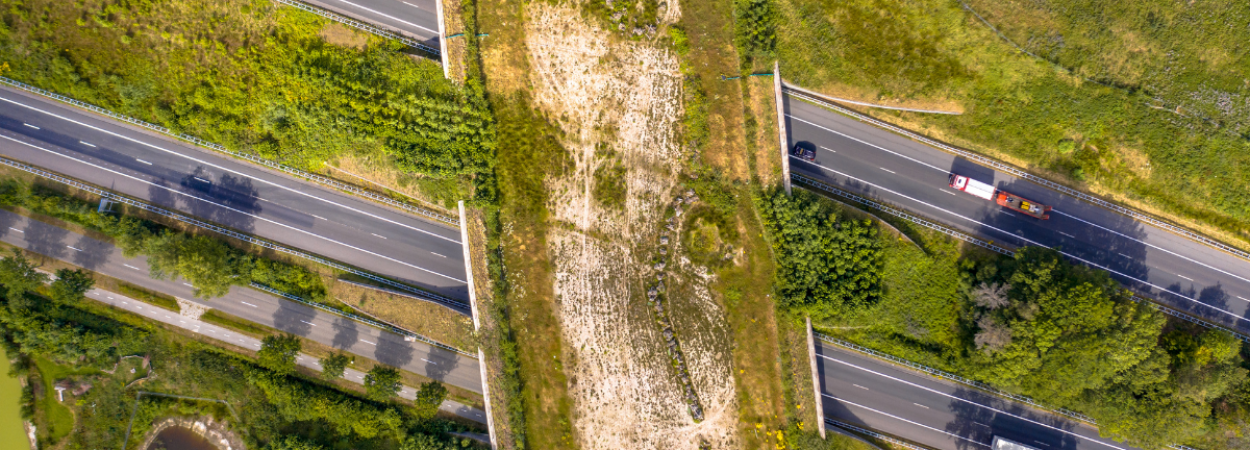
While the Priority Wildlife Connectivity Areas map has many applications — from land conservation to renewable energy siting — one of the most immediate uses is in transportation planning. ODOT can use this map to identify road segments that pose the greatest risk for wildlife-vehicle collisions and determine the best locations for wildlife crossings, such as underpasses or overpasses.

Wildlife-vehicle collisions are not only a danger to animals but can also endanger human safety, and can be costly. Strategic planning informed by OCAMP data means transportation agencies can reduce these risks while supporting Oregon’s biodiversity.

In the past, connectivity mapping in Oregon relied heavily on expert opinion, which left decision-makers without the robust data needed to guide policy and planning. The OCAMP project filled a major knowledge gap, with science-based connectivity models for 54 species representing different movement patterns and habitat needs. These models were combined to create the Priority Wildlife Connectivity Areas Map, which offers a statewide picture of the most critical areas for wildlife movement.

"We used tracking data where we had it, and presence and absence data to validate where the animals were. Then we put all the species together. In the final map, what you notice about it is that it's not for a particular species. It's just animal corridors, generalized. If we are really interested in a specific animal, we can always drill back in the data. But what the Legislature wanted was just a map of animal corridors in general that they could use to say, Okay, you're going to do this project. It's going to impact this corridor. So you need to put some kind of a crossing structure or fencing or some sort of mitigation," Lafrenz said.

WHO CAN USE THIS RESEARCH?

"Now that we have this information, the next big step is to shift into implementation. So how do we make sure that this tool is being used effectively? There are a lot of ways that we've done that, within the State government specifically. We're working with ODOT, to make them aware of where those Priority Wildlife Connectivity Areas intersect with our state highway system. We're also working with the Department of Land Conservation and Development, to guide siting and mitigation for new developments," Wheat said. 

ODFW has presented the Priority Wildlife Connectivity Areas map and tools to organizations including the Association of Oregon Counties and the League of Oregon Cities, as well as Federal land management agency partners.

"There are applications for the Bureau of Land Management, the U.S. Forest Service, the Fish and Wildlife Service, Land Trusts, soil and water conservation districts, watershed councils; basically anyone that's working in the conservation realm can benefit from this specific tool. There are also use cases for members of the public," Wheat said.

A paper by the research team, Visualizing Connectivity for Wildlife in a World Without Roads, was published in the journal Frontiers in Environmental Science.

"In that paper, we took southwestern Oregon and erased all the roads. And then we reran our model and compared, where would animals move if there were no roads as opposed to where we think they're moving now? We found that roads had a strong impact on connectivity. Roads influenced connectivity well beyond the footprint of the roadway," Lafrenz said.

Modeling wildlife movement in the absence of existing roads allowed for critical evaluation of where mitigation activities, such as wildlife crossing structures and fencing, could be most beneficial. This novel approach has practical applications for increasing connectivity for wildlife across roads. The high-resolution Priority Wildlife Connectivity Areas map also represents a new innovation in connectivity mapping; an area in which other states might follow Oregon's lead.

"Other states have engaged in statewide connectivity planning and mapping. One thing that sets OCAMP apart is that we used a much newer modeling approach, with much finer-scale spatial data. A lot of the tools that have been produced in other states in the past are at a very coarse spatial scale.Our maps are at a 30 meter resolution. So you can scale down to very small-scale efforts and get into very fine detail," Wheat said.

HOW INDIVIDUALS CAN HELP

ODFW developed a project specifically for roadkill in Oregon which makes use of data from iNaturalist, an online social network for recording observations of wildlife. 

"One of the things that we get asked a lot in our public communication is, how can the average person help provide information for connectivity? And one of the best ways that we found to do that is with iNaturalist," Wheat said.

The state has some information on where large-bodied wildlife, like deer and elk, are killed on roadways, because their maintenance crews remove them. But ODFW has very little information on smaller-bodied species. That's where iNaturalist comes in.

"Anyone with a cell phone can go out and snap a photo of a roadkill observation that they see. And then we can draw on that information to help identify roadkill hotspots and find the areas where we really need to focus on doing some sort of mitigation, whether that's crossing structures, habitat modification, or fencing to try to keep wildlife from getting killed on the road," Wheat said.

With a wide variety of applications for individuals, organizations, and governments, the Priority Wildlife Connectivity Areas map provides a critical tool for planning a connected future. For PSU researchers, OCAMP is an example of how science can inform policy and deliver real-world benefits.

Projects
1654
Researchers
lafrenz@pdx.edu
dtaylor@pdx.edu

Portland State University TREC researchers Kelly Clifton, Kristin Tufte and John MacArthur are among the co-authors of a May 2021 article published in Harvard Data Science Review. The paper, "Urban Sustainability Observatories: Leveraging Urban Experimentation for Sustainability Science and Policy," offers an outline of the requirements and research challenges involved in designing effective policies to meet sustainability goals for cities.

Humanity is experiencing revolutionary changes in the 21st century, including accelerating urbanization, the introduction of disruptive mobility technology services, and new sources of data generated and consumed by urban and mobility processes. However, the environmental, social, and economic sustainability implications of these new mobility services are unclear given the complex nature of urban systems and the multifaceted, contested nature of sustainability goals. The article discusses the concept of urban sustainability observatories that leverage urban experimentation through ongoing data collection and analysis capabilities. The researchers also discuss challenges in building and sustaining these observatories and how university, community, and industry partnerships may establish successful observatories that serve as critical drivers of research, technology transfer, and commercialization. 

Photo by hapabapa/iStock

The Transportation Research and Education Center (TREC) at Portland State University is home to the National Institute for Transportation and Communities (NITC), the Initiative for Bicycle and Pedestrian Innovation (IBPI), and other transportation programs. TREC produces research and tools for transportation decision makers, develops K-12 curriculum to expand the diversity and capacity of the workforce, and engages students and professionals through education.

Researchers
macarthur@pdx.edu

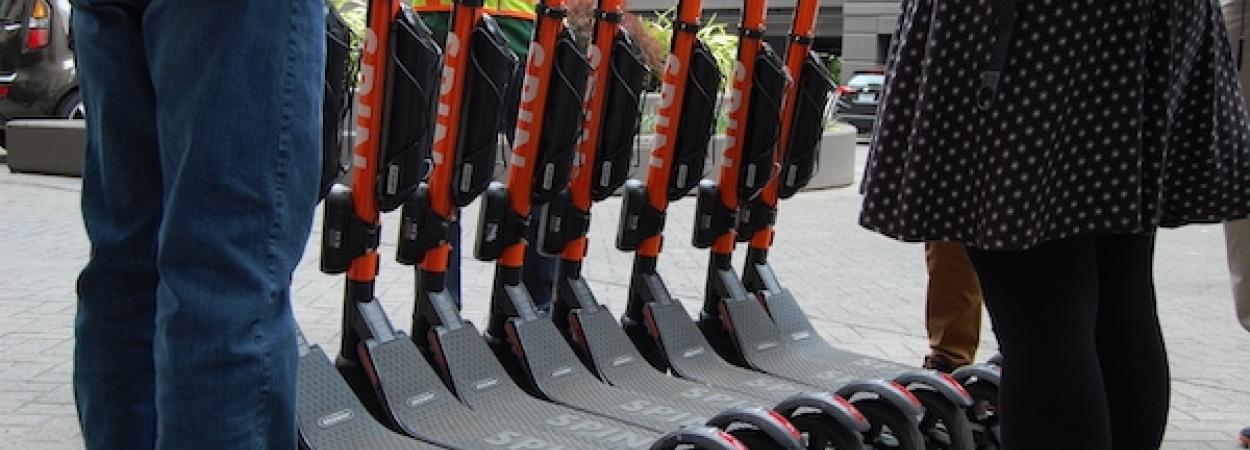
A new paper in the Journal of Planning Literature by Michael McQueen, Gabriella Abou-Zeid, John MacArthur and Kelly Clifton of PSU took a look at micromobility. The article focuses on the role of new modes like shared e-scooters in the efforts to cultivate a more sustainable transportation system by reducing greenhouse gas emissions, providing a reliable and equitable transportation service, and enhancing the human experience. Their review of the literature shows that the sustainability impacts of these modes are at present mixed, and are likely to remain so without more targeted interventions by local stakeholders. Yet, the operations and use of micromobility systems are quickly evolving and hold promise for contributing to a more sustainable transportation system.

Read the online journal article, or access the free author version (PDF) here.

Authored by Mike McQueen and John MacArthur, Portland State University

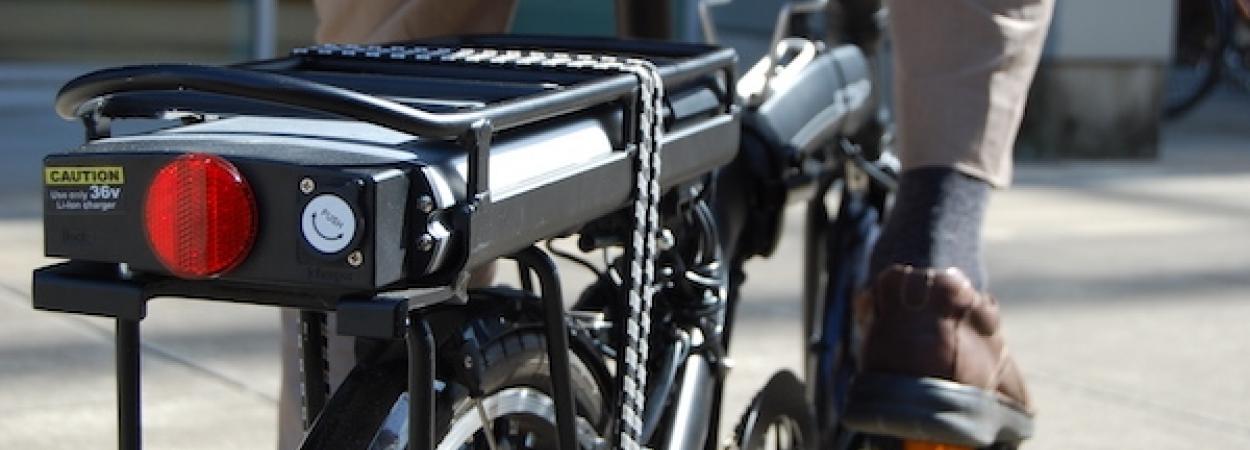
Electric bikes (e-bikes) are quickly becoming common in U.S. cities and suburbs, but we still have a ways to go compared to our neighbors across the Atlantic.  In recent years, e-bike sales have steadily increased with unprecedented growth in Europe, especially in the Netherlands. Can the U.S. catch up? E-bikes offer a cheaper alternative to car travel and also provide physical activity. Riders with limited physical ability find that e-bikes extend their overall mobility. Beyond the practical, e-bikes are also just fun to ride. In fact, e-bikes encourage users to cycle farther and more often than conventional bicycles. More importantly to local and regional U.S. governments, e-bikes could be a useful tool to address our current climate crisis by reducing transportation greenhouse gas (GHG) emissions.

Related research: MacArthur and McQueen are also working with the National Science Foundation to collect e-bike user data via onboard technology. To learn more or participate in that study, visit the Mobility By E-Bike Project.

E-bike incentive programs in the U.S. remain relatively small in scale. Currently, California and Oregon offer statewide incentive programs that provide rebates towards the purchase of battery electric vehicles (BEV), plug-in hybrid electric vehicles (PHEV), and fuel cell electric vehicles (FCEV). These programs are intended to reduce state GHG emissions from the transportation system. Could incentivizing e-bikes also be a cost-effective way for regions to reach their greenhouse gas emission reduction goals?

Today the Transportation Research and Education Center (TREC) at Portland State University launches a new Electric Vehicle Incentive Cost and Impact Tool. This online tool enables policymakers, public stakeholders, and advocates to quickly visualize the potential outcomes of an electric vehicle incentive program made up of several vehicle types. The tool estimates the cost efficiency of a proposed program in terms of the cost per kg CO2 avoided by each mode over the course of one year. It also takes the proposed budget into consideration to calculate the potential number of incentives to be made available and the amount of total CO2 that would be avoided due to internal combustion engine automobile (ICE) VMT displacement.

To show you how it works, we tried out the tool with Oregon as a case study. Currently, the state sets aside about $12M per year for its Oregon Clean Vehicle Rebate Program, with rebates usually offered at $2,500 each for BEV and PHEV vehicles with battery capacity of 10 kWh or more and $1,500 for vehicles with batteries with less than 10 kWh. How do BEVs, PHEVs, and e-bikes compare in terms of incentive program cost efficiency and greenhouse gas emissions avoided?

USING THE EV INCENTIVE COST AND IMPACT TOOL: AN OREGON CASE STUDY

Creating your EV Incentive Program

First, let’s get the tool set up with information for the state of Oregon. We’ve designed the tool with all of the data you need, and you simply choose the presets for your scenario. It’s also easy to use your own data by just entering it directly into the tool. Apply presets with information for the electricity generation emissions profile from the US EPA eGRID, average car travel information from the NHTS, and national ICE fuel efficiency information from the US Bureau of Transportation Statistics.

 [[{"fid":"4916","view_mode":"default","fields":{"format":"default"},"type":"media","field_deltas":{"19":{"format":"default"}},"attributes":{"class":"media-element file-default","data-delta":"19"}}]]

Next, apply some information about the vehicles you’re looking to incentivize. Again, we’ll just use presets that we’ve created: 

  • The E-Bike preset is an average of the fuel economies of several e-bike models studied in a recent paper by Efficiency Vermont. It may be unreasonable to expect most people to completely replace all of their automobile VMT with an e-bike. To account for this, we specify that the average user will only replace 15% of their VMT with their incentivized e-bike. 

  • The BEV preset is a weighted average of fuel economies provided by the US EPA of the current BEV fleet in Oregon. 

  • Similarly, the PHEV preset is a weighted average of fuel economies provided by the US EPA of the current PHEV fleet in Oregon. Fleet information was obtained from the Oregon Department of Transportation (ODOT) based on historical rebate distribution within the state.

[[{"fid":"4917","view_mode":"default","fields":{"format":"default"},"type":"media","field_deltas":{"20":{"format":"default"}},"attributes":{"class":"media-element file-default","data-delta":"20"}}]]

Lastly, we can set our incentive amounts and total budget. We can also choose how to distribute our budget among the vehicles we’re incentivizing. Let’s set the BEV and PHEV incentive to $2,500 and the total budget to $12M, similar to Oregon’s current program. We’ll try out an e-bike incentive of $350, and for this example we’ll split the budget evenly among each vehicle type.

[[{"fid":"4901","view_mode":"default","fields":{"format":"default"},"type":"media","field_deltas":{"4":{"format":"default"}},"attributes":{"class":"media-element file-default","data-delta":"4"}}]]


Once you’re all done creating your incentive program scenario, you can export a report for quick reference when discussing options with other stakeholders.

Review the Results: What did we find in Oregon?

First off, we get some information about incentive cost efficiency. It turns out that the e-bike incentive is more cost efficient, in terms of cost per kg CO2 saved, than both the BEV and PHEV incentives.

[[{"fid":"4902","view_mode":"default","fields":{"format":"default"},"type":"media","field_deltas":{"5":{"format":"default"}},"attributes":{"width":"600","class":"media-element file-default","data-delta":"5"}}]]

[[{"fid":"4904","view_mode":"default","fields":{"format":"default"},"type":"media","field_deltas":{"7":{"format":"default"}},"attributes":{"class":"media-element file-default","data-delta":"7"}}]]

Next, we can look at the total number of incentives our program is able to provide. Because the e-bike incentive is much lower in price, the program is able to impact almost 10 times as many people’s lives with a new e-vehicle compared to the BEV or PHEV incentives given our $12M budget.

[[{"fid":"4903","view_mode":"default","fields":{"format":"default"},"type":"media","field_deltas":{"6":{"format":"default"}},"attributes":{"width":"600","class":"media-element file-default","data-delta":"6"}}]]

[[{"fid":"4905","view_mode":"default","fields":{"format":"default"},"type":"media","field_deltas":{"8":{"format":"default"}},"attributes":{"class":"media-element file-default","data-delta":"8"}}]]

Lastly, let’s look at the GHG impacts of our program over the course of 1 year. The program is able to reduce the amount of CO2 emissions of one year by about 25M kg thanks to the incentive program we designed. Given how we’ve structured this incentive program, e-bikes make up the largest portion of this CO2 savings, about 40% of the entire impact.

[[{"fid":"4906","view_mode":"default","fields":{"format":"default"},"type":"media","field_deltas":{"9":{"format":"default"}},"attributes":{"width":"600","class":"media-element file-default","data-delta":"9"}}]]

[[{"fid":"4907","view_mode":"default","fields":{"format":"default"},"type":"media","field_deltas":{"10":{"format":"default"}},"attributes":{"width":"600","class":"media-element file-default","data-delta":"10"}}]]

“What-if” Scenarios for E-bike Incentive Amounts

Let’s do a quick set of “what-if” scenarios to see how changing the e-bike incentive from $350 impacts the results.

What if the e-bike incentive was $150?

What we found for a $150 e-bike incentive (versus $350):

  • The cost per kg of CO2 saved has decreased, from $0.40 to $0.17.
  • The number of e-bike incentives we can offer has more than doubled, from 11,314 to 26,400.
  • Similarly, the amount of CO2 avoided due to e-bikes has also more than doubled, from 10.2M kg to 23.9M kg. This accounts for 61% of the total CO2 savings in this case.

What if the e-bike incentive was $500?

What we found for a $500 e-bike incentive (versus $350):

  • The cost per kg CO2 saved has gone up from our initial case study, from $0.40 to $0.55 per kg CO2 saved. However, this is on par with the cost efficiency of the PHEV incentive.
  • The number of e-bike incentives that can be offered has decreased, from 11,314 to 7,920. However, we’re still able to offer more incentives than the BEV and PHEV incentives combined.
  • Lastly, the total CO2 saved has also declined, from 10.2M kg to 7.2M kg, although it is still on par with the BEV and PHEV categories.

Final Thoughts

This case study has shown that e-bikes could be a strong player as part of a CO2 avoidance e-vehicle incentive program. In some cases, e-bikes could perform better than electric vehicles in terms of cost efficiency, number of incentives provided, and total CO2 saved.

The Electric Vehicle Incentive Cost and Impact Tool is available online, and is able to generate a downloadable report for sharing purposes.

Contact John MacArthur (macarthur[at]pdx.edu) with any questions or comments about the tool, and let us know how you used it!

ABOUT THE AUTHORS

John MacArthur

Sustainable Transportation Program Manager

John MacArthur is the Principal Investigator for TREC's electric bicycle research initiatives. His research also includes low-/no-emission vehicle infrastructure in Portland metro, as well as a climate change impact assessment for surface transportation in the Pacific Northwest and Alaska. Before joining the TREC staff, John was the Context Sensitive and Sustainable Solutions Program Manager for the Oregon Department of Transportation’s OTIA III State Bridge Delivery Program.

Mike McQueen

Graduate Research Assistant

Mike McQueen is a second year master's student working with John MacArthur of TREC and Dr. Kelly Clifton of the MCECS Department of Civil and Environmental Engineering. Currently, Mike is researching e-bike travel behavior and micromobility as an Eisenhower Fellow. In the past, he has studied e-bike purchase incentive programs, the potential positive environmental impact of e-bikes in Portland, BIKETOWN, and the demographics of zero car households.

The Transportation Research and Education Center (TREC) at Portland State University is home to the National Institute for Transportation and Communities (NITC), the Initiative for Bicycle and Pedestrian Innovation (IBPI), and other transportation programs. TREC produces research and tools for transportation decision makers, develops K-12 curriculum to expand the diversity and capacity of the workforce, and engages students and professionals through education.

Researchers
macarthur@pdx.edu