Researchers Aaron Golub, John MacArthur and Sangwan Lee of Portland State University, Anne Brown of the University of Oregon, and Candace Brakewood and Abubakr Ziedan of the University of Tennessee, Knoxville have published a new journal article in the September 2022 volume of Transportation Research: Interdisciplinary Perspectives

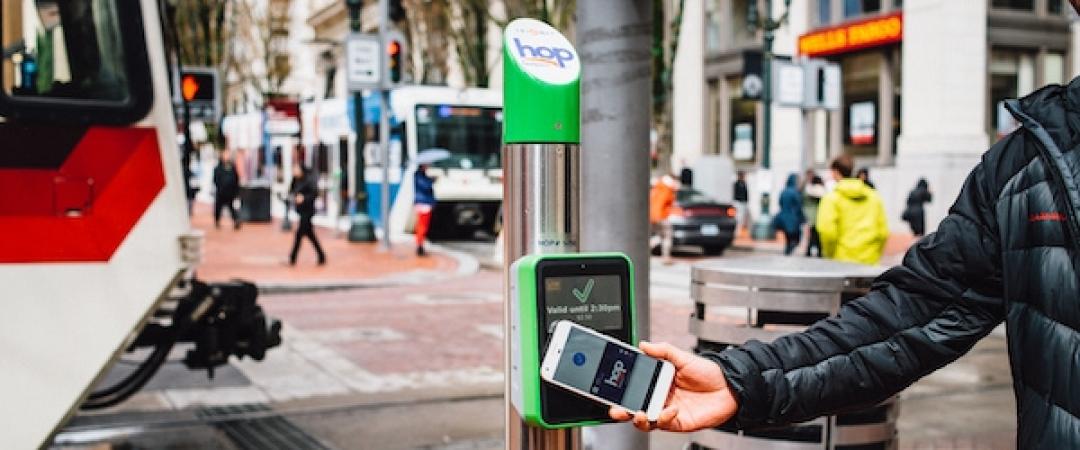
Rapidly-evolving payment technologies have motivated public transit agencies in the United States to adopt new fare payment systems, including mobile ticketing applications. The article, "Equity and exclusion issues in cashless fare payment systems for public transportation," explores the challenges facing transit riders in the U.S. who lack access to bank accounts or smartphones, and potential solutions to ensure that a transition to cashless transit fares does not exclude riders. Learn more about the project and read an open-access version of the final report.

The study asks: who is most at risk of being excluded by the transition to new fare payment systems and how would riders pay transit fares if cash payment options were reduced or eliminated? Researchers answer these questions using intercept surveys of 2,303 transit riders in Portland-Gresham, OR, Eugene, OR, and Denver, CO.

The article's authors explore existing research on emerging fare payment systems, as well as research on disparities in access to the various pieces of the new payment ecosystem, including credit and banking, Internet and smartphones. They then present qualitative and quantitative analyses used to investigate this topic, and conclude with a discussion of results and implications for policy and planning. The paper is based on a pooled-fund study supported by the National Institute for Transportation and Communities (NITC). Read more about the original study: Applying an Equity Lens to Automated Payment Solutions for Public Transportation

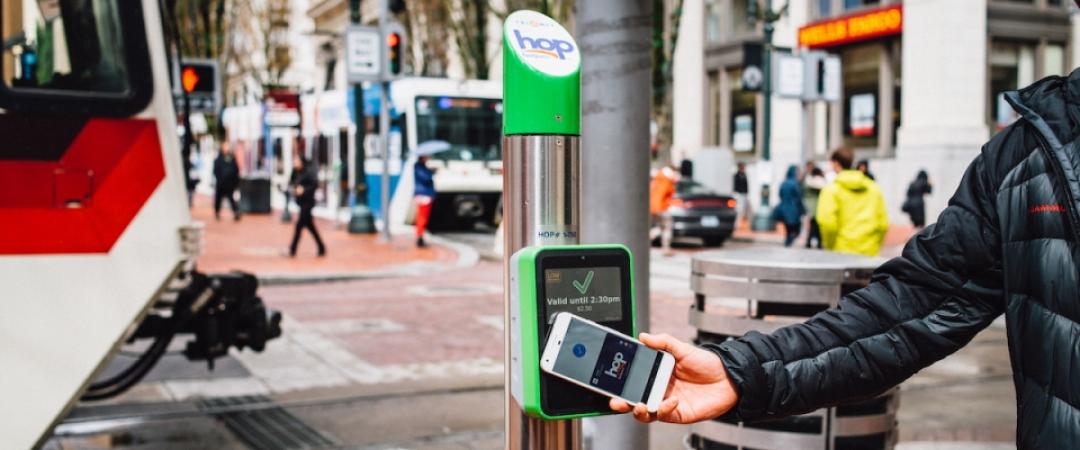
Photo courtesy of TriMet

The National Institute for Transportation and Communities (NITC) is one of seven U.S. Department of Transportation national university transportation centers. NITC is a program of the Transportation Research and Education Center (TREC) at Portland State University. This PSU-led research partnership also includes the Oregon Institute of Technology, University of Arizona, University of Oregon, University of Texas at Arlington and University of Utah. We pursue our theme — improving mobility of people and goods to build strong communities — through research, education and technology transfer.

Projects
1268
Researchers
agolub@pdx.edu

In 2020, the COVID-19 pandemic drastically impacted travel for in-person shopping, commute trips, global supply chains, and food business operations. E-grocery pickup and delivery services saw unprecedented expansions in response. The adoption and use of these e-grocery services have implications for equity and mobility. A PSU masters thesis offers insights: "Adoption and Use of E-Grocery Shopping in the Context of the COVID-19 Pandemic: Implications for Transport Systems and Beyond" by Gabriella Abou-Zeid, a 2021 graduate of Portland State University with a masters in civil engineering.

"While the future adoption and use of e-grocery services is uncertain as the COVID-19 pandemic evolves, our analysis revealed a clear impact of the pandemic on e-grocery shopping behaviors, which has impacts for transportation network demand, safety, and equity," Abou-Zeid said.

Enhancing our understanding of the drivers of (and barriers to) online grocery shopping and its potential "stickiness"—or the extent to which e-grocery use will continue at the same or higher frequencies after the pandemic—is a prerequisite for unpacking current and future consequences of this ecommerce sector on people and transportation networks. The two goals of this work are:

  1. To explore the drivers of adoption and use of e-grocery services in the context of the COVID-19 pandemic, and
  2. To estimate "stickiness" of online grocery ordering behaviors – or the extent to which e-grocery use will continue at the same or higher frequencies after the pandemic.

Survey data (N=2,266) capturing household and individual information on demographics, attitudes, and behaviors were all employed in carrying out these goals. The culmination of results show attitudes and COVID-19 related variables are strong drivers of e-grocery adoption, use, and stickiness. COVID-19 related characteristics—including individual and household experiences related to employment, income, remote work, diagnosis, food insecurity, and changes in food shopping behaviors—were found to be significant across the suite of estimated models, demonstrating the sheer impact of the pandemic on household provisioning behaviors. Results from the "stickiness" analysis suggests households that are multimodal, below retirement age, and located in places with high e-grocery service availability are more likely to hold or increase their already elevated e-grocery usage. Households who have at least one member particularly vulnerable to COVID-19 or who reduced their in-store shopping frequency during the pandemic are also more likely to have e-grocery shopping "stick". Drivers of e-grocery delivery adoption varied among household income levels.

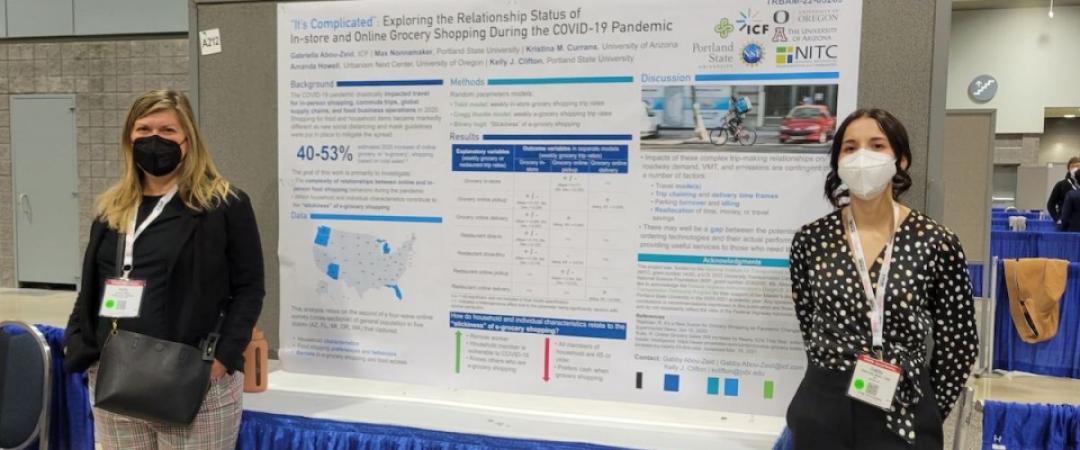
“It’s Complicated”: Exploring the Relationship Status of In-store and Online Grocery Shopping During the COVID-19 Pandemic (View PDF)

One theme resurfaced consistently throughout the analysis: the importance of attitudes in predicting behavior. “Attitudinal variables showed significance across all models examining e-grocery adoption, use, and ‘stickiness’. As just one example, households who knew others who shopped for groceries online, and who thought shopping online was easy, were more likely to demonstrate e-grocery adoption and use, and were more likely to continue e-grocery shopping behaviors after the pandemic. Households who preferred to use cash when grocery shopping were less likely to continue use of e-grocery shopping after the pandemic, which points to a potential barrier for un- or underbanked households in being able to easily use these services”, Abou-Zeid noted.  

The work concludes with a synthesis of findings, highlighting key drivers of and barriers to online grocery shopping, the impacts of the COVID-19 pandemic on e-grocery, and implications for transportation systems and practice. This discussion includes recommendations for policy and future work.

The data collection effort, led by Dr. Kelly Clifton, supporting this research was funded by the National Science Foundation (NSF) and the National Institute for Transportation and Communities (NITC). Abou-Zeid would also like to acknowledge the Federal Highway Administration’s (FHWA) Dwight D. Eisenhower Transportation Fellowship Program (DDETFP) and the National Institute for Transportation and Communities (NITC) for the financial and professional support provided while developing her thesis.

Abou-Zeid presented this research in a poster session (download the PDF) at the 2022 annual meeting of the Transportation Research Board (TRB). She also presented her work at the two previous TRB conferences in 2020 and in 2021, where she was awarded her first and second Eisenhower Fellowship.

Abou-Zeid now works as a Transportation Data Specialist at ICF, supporting local, state, and federal clients in areas of transportation demand management (TDM), transportation systems management and operations (TSMO), public transportation investments, transportation and land use intersections (especially related to parking), and sustainable mobility. She currently resides in Tucson, AZ, where her transportation research journey began while researching walkability. 

Photo courtesy of Gabby Abou-Zeid

Portland State University's Transportation Research and Education Center (TREC) is home to the U.S. DOT funded National Institute for Transportation and Communities (NITC), the Initiative for Bicycle and Pedestrian Innovation (IBPI), PORTAL, BikePed Portal and other transportation grants and programs. We produce impactful research and tools for transportation decision makers, expand the diversity and capacity of the workforce, and engage students and professionals through education and participation in research.

Active transportation investments offer many types of benefits related to safety, reduced greenhouse gas emissions, physical activity and the economy. Metro, Oregon’s regional government for the Portland metropolitan area, wants to better understand the role of these investments in building stronger communities in their region, and in implementing the Metro 2040 Growth Concept.

Led by Portland State University in partnership with Metro, the Active Transportation Return on Investment (ATROI) study looked at twelve projects constructed in the greater Portland region between 2001 and 2016. These twelve 2040 Catalyst Projects were evaluated to determine if active transportation investments had significant effects on the local economy. 2040 Catalyst Projects retrofit busy commercial streets with pedestrian-friendly treatments to catalyze economic development within 2040 Centers, Main Streets, or Station Communities. 

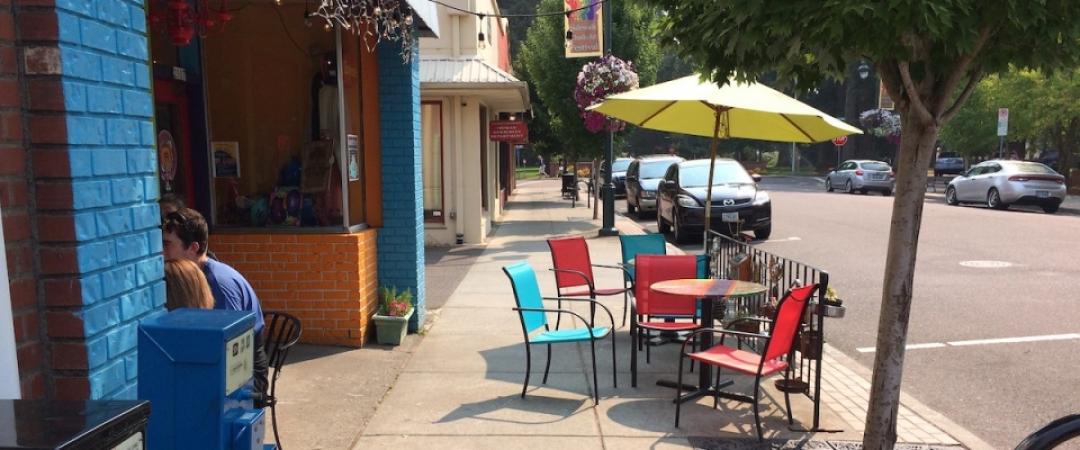
Redesigned streets can improve economic conditions by creating attractive and walkable business districts, providing access to various destinations, local businesses, and jobs. Nearly all the projects focus primarily on pedestrian improvements, such as improved sidewalks (new, widened, etc.), safer crossings (signals, rectangular rapid flash beacons, curb extensions, crosswalks, signage, ramps, etc.), improved bus stops, landscaping (trees, bioswales for stormwater management, etc.), lighting, and public art. A few projects also included new or restriped bike lanes, shared lane markings, and/or bike parking.

PSU researchers Jennifer Dill, Jenny Liu and Marisa Zapata evaluated two main components: 

  • A quantitative analysis on the economic benefits of 12 active transportation projects on busy commercial streets.
  • A qualitative assessment of the projects to help tell the story and understand other benefits and impacts of each project. This was conducted through stakeholder interviews, online surveys, and existing feedback recorded from other projects (intercept surveys, surveys of residents of TODs, etc).

"Taking both a quantitative and qualitative approach was important, so we could better understand the numbers and hear directly from the people, including customers and business owners, about the value of the projects. However, our work was done mainly in 2020, so we had to get creative in how we found those people, including an online survey and social media.," Dill said.

Overall, the research team found positive effects on business activity in the retail and/or food sectors, demonstrating that the potential economic benefits are not just in more urban parts of the city of Portland:

  • 75% of the project locations saw measurable economic gains in the food or retail industries after implementation.
  • Layering complementary investments (e.g. light rail stations and transit oriented-development) has the potential to yield the greatest benefits.
  • The projects that did not see positive effects tended to have higher traffic volumes and/or speeds. Projects are more likely to reach their full potential when they reduce the effects of an auto-oriented environment and create places for walking that are also less stressful and more comfortable.

"The findings reveal that these types of investments can have positive outcomes in places outside of downtown and inner Portland, particularly when coupled with other planning and infrastructure investments, but that we do need to address the negative effects of high speed, multi-lane arterials," Dill said.

Together they help us understand many of the benefits of these recent active transportation projects that used regional flexible funding in the past. One of the most important outcomes of the study is informing the region’s decision makers, business owners, and the general public in the recent public comment period for Metro’s Regional Flexible Funding Allocations (RFFA) for transportation projects. With 29 project proposals on the table, it’s important to have the context and data on what has been effective in the Portland region.

ABOUT THE PROJECT

Active Transportation Return on Investment Study

Jennifer Dill, Jenny Liu, and Marisa Zapata; Portland State University

The study was funded by Portland Metro and conducted by researchers at PSU and Metro, with report design from Alta Planning + Design. The PSU team included Jennifer Dill, Jenny Liu, Marisa Zapata, Minji Cho, Kyuri Kim, Natalie Chavez, Natalie Knowles, and Lacey Friedly.

Photo courtesy of Oregon Metro.

Portland State University's Transportation Research and Education Center (TREC) is home to the U.S. DOT funded National Institute for Transportation and Communities (NITC), the Initiative for Bicycle and Pedestrian Innovation (IBPI), PORTAL, BikePed Portal and other transportation grants and programs. We produce impactful research and tools for transportation decision makers, expand the diversity and capacity of the workforce, and engage students and professionals through education and participation in research.

Projects
1543
Researchers
jdill@pdx.edu
jenny.liu@pdx.edu
mazapata@pdx.edu

Would monetary incentives encourage more people to buy e-bikes? 

Portland State University (PSU) researchers are examining how purchase incentive programs can expand the current e-bike market, and the latest product to come out of this research is a white paper released earlier this month: “Using E-Bike Purchase Incentive Programs to Expand the Market – North American Trends and Recommended Practices (PDF)

The paper offers methods of identifying the most effective program structure for the incentive provider's priorities, and helpful information on how to administer and track the program. 

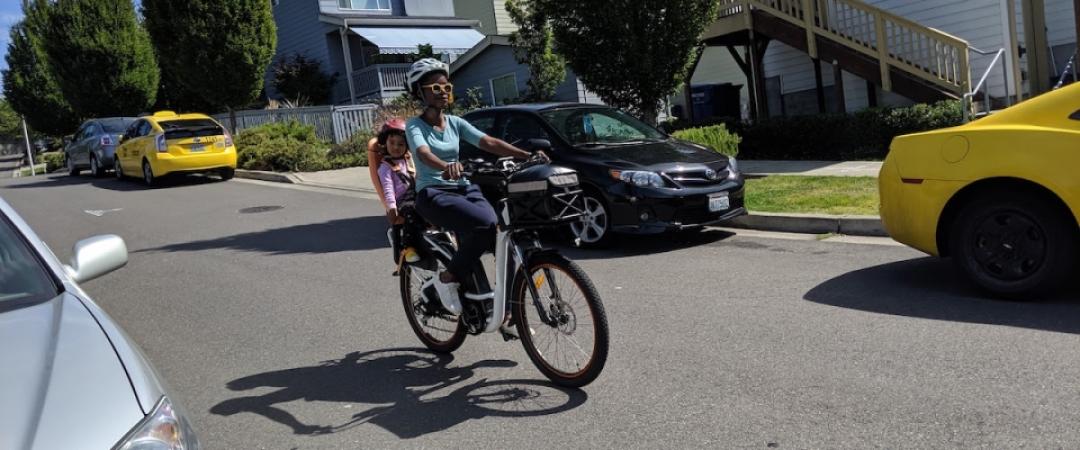
A great number of cities in the United States have cycling goals, and a great way to address those is by promoting e-bikes, because they provide for a much wider range of users than a traditional bike does," said Cameron Bennett, who is a master student in transportation engineering at PSU.

Bennett co-authored the paper with John MacArthur of PSU; Christopher Cherry of the University of Tennessee, Knoxville; and Luke Jones of Valdosta State University. The authors reviewed impacts and statistics from around 75 current, past, and proposed e-bike incentive programs in North America, and also interviewed industry leaders, academics and incentive program managers to identify key considerations. Streetsblog USA interviewed MacArthur on what the team found and the implications for program administrators.

Funded by the National Institute for Transportation and Communities (NITC) and PeopleForBikes, the multi-part research project has three stages:

  1. Tracking current and proposed e-bike incentive programs in North America (for more on that, see our Jan 2022 story or see the live online tracker spreadsheet);
  2. Evaluating practices, trends and case studies in those programs (download the white paper or watch the May 2022 webinar);
  3. Learning more about potential e-bike buyers and how incentive programs could influence their decision-making.

Later this year the team will publish the results of a national stated preference survey (take the survey here), aimed at learning the potential effects of different rebate methods, cash amounts, demographics and other factors. This will yield even more insight into what affects people's decision-making, and which types of incentive programs may hit the sweet spot.

John MacArthur has a long track record in e-bike research, and he and Christopher Cherry collaborate on research for the Light Electric Vehicle Education and Research (LEVER) Institute.

Photo by Dongho Chang

The Transportation Research and Education Center (TREC) at Portland State University is home to the National Institute for Transportation and Communities (NITC), the Initiative for Bicycle and Pedestrian Innovation (IBPI), and other transportation programs. TREC produces research and tools for transportation decision makers, develops K-12 curriculum to expand the diversity and capacity of the workforce, and engages students and professionals through education.

Projects
1332
Researchers
macarthur@pdx.edu

Our multi-year study on automated transit fare collection offers a key finding that won't surprise you: Despite the convenience, the rush toward cashless fare systems has created barriers for lower-income riders seeking to use transit. Results from focus groups, surveys, and a review of current transit agency practices suggest that continuing to accept cash is a crucial way to keep transit accessible. However, dealing with cash has drawbacks: it’s time intensive and expensive. Using a detailed cost-benefit model, the researchers explored the costs for agencies to maintain some cash options and found that some simple approaches can be quite effective. The best bang for the buck? Cash collection on board buses.

Launched in 2019, the research project "Applying an Equity Lens to Automated Payment Solutions for Public Transportation" was supported by a Pooled Fund grant program from the National Institute for Transportation and Communities (NITC) and conducted at three universities: Portland State University (PSU), the University of Oregon (UO), and the University of Tennessee, Knoxville (UTK). The other funding partners were City of Eugene, OR, City of Gresham, OR, Lane Transit District, Clevor Consulting Group, and RTD (Regional Transportation District) Denver.

Aaron Golub of PSU served as the principal investigator, with co-investigators Anne Brown of UO, Candace Brakewood of UTK and John MacArthur of PSU.

WHY STUDY CASHLESS TRANSIT FARE?

Automated payment technologies can smooth operations and improve data collection, but the added convenience for the agency and some riders comes at a price: those systems require riders to have access to private internet, smartphones, and banking/credit services. Access that is decidedly not universal. What happens to the riders who are left behind?

Fare payment systems have a long history in significant equity challenges - both in fare amounts, but also in how and where fare can be purchased and stored. The final report “Applying an Equity Lens to Automated Payment Solutions for Public Transportation” (PDF) is a detailed exploration of how transit riders pay for their fare, based on 2,303 intercept surveys and three focus groups with transit riders in Colorado and Oregon. Researchers looked at the use of cash, and focused on riders who may be excluded if cash options are removed as new fare payment systems are implemented in the coming years. The research team also interviewed employees at ten transit agencies to find out how their fare payment has been modernized in the past 5 years, how those agencies have evaluated the equity implications of these changes, and what programs they have deployed to mitigate the equity impacts.

Andrew Martin, Development Planner at Lane Transit District, served on the project's technical advisory committee. "Around the same time as this study, we were in the middle of purchasing and implementing our first electronic fare collection system. We had already decided to take a more customer-centric approach: instead of going completely cash-free, we determined that we were going to take on the costs of making sure our service remained accessible to all riders. It was good to see, in the research, a lot of the things that we were intuitively feeling turned out to be true. The cost-benefit analysis shows that the cost isn't as great as you think; by doing the equity mitigations, you might end up with higher ridership and offset the revenue loss," Martin said.

SOME KEY FINDINGS

Researchers found that a significant number (around 30%) of transit riders still rely heavily on paying cash on-board buses. Older and lower-income respondents had less access to smartphones and internet. 

Of those who do own smartphones, many are concerned about reaching data limits, and some depend solely on public Wi-Fi for internet connectivity. 

A small but significant number of riders (around 7%) have no access to formal banking services.

The researchers worked with transit organizations in three case cities: Eugene, OR (population 247,421); Denver, CO (population 2,374,203); and Portland, OR (population 1,849,898). The cost-benefit model can be used by any size agency to implement new fare payment technology.

"One thing that would be really helpful to a lot of agencies is the cost modeling [the researchers] did. It estimates the general cost to put new technologies out there, like ticket vending machines. A lot of smaller agencies may not have things like that, and they're really useful for customers. So even aside from the equity focus, there is a lot of good info on costs of implementing a system," said Martin.

COST BENEFIT MODEL

Researchers constructed a quantitative cost-benefit model that combines first-year capital investments along with 10 years of maintenance, operations and capital replacement into a single total cost estimate. This approach creates an overall reflection of the lifecycle costs of the fare payment system, meaning it enables us to understand the total cost from both the initial costs, as well as the recurring annual costs.

They then used the model to explore and compare four scenarios along with an additional base (no-cash) case. Scenarios are based on the feedback received from transit agencies and a review of best practices nationally: 

  • Base - (No cash accepted anywhere)
  • Scenario 1 - No cash anywhere, adds retail network
  • Scenario 2 - Cash on board, not at TVMs, no retail
  • Scenario 3 - Cash only at TVMs, no retail
  • Scenario 4 - Cash accepted everywhere

"The heart of this cost-benefit model is, how many riders cannot ride under the different scenarios? We were able to study more than 2,000 riders, and, in the fully no-cash base case, we knew that about 8% of riders could not ride, based on our surveys. Their answers to how they would  ride with different configurations of ticket vending machines and cash on board informed this model," Golub said.

SELECTING MITIGATION STRATEGIES

Any of the above scenarios 1-4, above the no-cash baseline, can mitigate some of the equity implications of going cashless. Which scenario is best for a particular setting depends greatly on how many riders are potentially excluded by a cashless fare system, and on which options those riders would most likely use, given the opportunity to pay with cash. Based on the results of the cost-benefit analysis for each of the three case cities, researchers developed some general principles that agencies should keep in mind, when choosing strategies to help keep transit accessible. 

"When you're looking at 10 different systems and you've got to justify to the board, the general manager, the community, why you're spending money a certain way – it's really helpful to have research like this that shows that the costs are not some huge amount. When equity is cheap to obtain, it's really easy to justify doing that," Martin said.

Larger agencies spend less to collect fare. This impacts the cost-benefit calculation of adding additional capabilities. Small agencies, the researchers suggest, should seriously consider going fare-free. The Eugene case study (the smallest agency) shows that, across the board, fare collection consumes a large part of fare revenues - in the full cash scenario, about 40% of revenue is spent on collecting fare. 

Retail is a low-cost option: Accepting cash payments at retail locations is by far the lowest cost option to add cash capabilities in terms of total cost, net costs, and in terms of cost to accommodate potentially excluded riders. It is also the most commonly used mitigation, according to interviews with agencies. However, the retail network still poses significant geographical barriers for many riders, and does not offer the kind of coverage and access that cash collection on-board would offer.

Simple cash collection on buses could be an important bridge: According to the ridership survey data, in addition to being a low-cost option for agencies, this mitigation also added significant ridership. Accepting cash at ticket vending machines was found to be much more expensive than accepting cash on board.

When larger numbers of riders are excluded, equity mitigations are cheaper. The larger number of riders that are excluded, the bigger impact equity mitigations have and the cheaper they are per additional rider, and per additional fare collected. The Portland-Gresham case study showed relatively few riders were excluded when cash was eliminated compared to the other properties. That meant that adding retail cash collection cost $0.27 per new boarding. In Denver and Eugene, larger populations of riders were potentially excluded by cashless fare, and adding retail capabilities only cost 14 and 1.9 cents per boarding, respectively.

"Within the 10-year transition, some of the worst effects could be avoided by using some of these mitigations,” Golub told NextCity in a May 25, 2021 article: What Happens When Cash Fares Are Eliminated?

This research was funded by the National Institute for Transportation and Communities; the City of Eugene, OR, City of Gresham, OR, Lane Transit District, Clevor Consulting Group, and RTD (Regional Transportation District) Denver.

ABOUT THE PROJECT

Applying an Equity Lens to Automated Payment Solutions for Public Transportation

Aaron Golub and John MacArthur, Portland State University; Anne Brown, University of Oregon; Candace Brakewood, University of Tennessee, Knoxville

Photo courtesy of TriMet

RELATED RESEARCH

To learn more about this and other NITC research, sign up for our monthly research newsletter.

The National Institute for Transportation and Communities (NITC) is one of seven U.S. Department of Transportation national university transportation centers. NITC is a program of the Transportation Research and Education Center (TREC) at Portland State University. This PSU-led research partnership also includes the Oregon Institute of Technology, University of Arizona, University of Oregon, University of Texas at Arlington and University of Utah. We pursue our theme — improving mobility of people and goods to build strong communities — through research, education and technology transfer.

Projects
1268
Researchers
agolub@pdx.edu

In June 2019, the City of Portland Bureau of Transportation (PBOT) launched a new incentive package aimed at making transportation more accessible for low-income households. In the "Transportation Wallet for Residents of Affordable Housing" pilot program, people living in affordable housing developments received access to free transportation options like transit passes, bike or scooter share memberships, rideshare and carshare credits.

Portland State University researchers evaluated the pilot program to find out how participants used the Transportation Wallet and how it helped them use different transport modes to get around.

A February 2021 paper in Transportation Research Record by Huijun Tan, Nathan McNeil, John MacArthur and Kelly Rodgers presents insights into the implementation and effectiveness of a transportation financial incentive program for low-income populations. Access the paper: "Evaluation of a Transportation Incentive Program for Affordable Housing Residents."

Main findings include:

  1. The financial support of this program encouraged some participants to use new mobility services (including Uber/Lyft, bike share, and e-scooter) that they had never used before.
  2. The program increased access for participants, helping them make more trips and, for some, get to places they otherwise could not have gone.
  3. Transportation fairs, where participants could learn about services and talk to providers, promoted both mode sign-up and mode usage, particularly for new mobility services and a reduced fare transit program.

The article is part of a larger research effort underway, funded by the National Institute for Transportation & Communities, Metro, and PBOT: "New Mobility For All: Can Targeted Information And Incentives Help Underserved Communities Realize The Potential Of Emerging Mobility Options?" This project explores underserved communities' access to new mobility programs such as ride-hailing, car-sharing, and micromobility. Researchers surveyed participants of PBOT's Transportation Wallet pilot, as well as a program of Oregon Metro designed to provide personalized transportation planning services (trip planning, education, outreach) in combination with free ride or drive credits from ride-hail and car share services to help connect residents to travel opportunities. An update on the project will be given in an upcoming Friday Transportation Seminar:

Friday, April 16, 2021: Friday Transportation Seminar: Evaluation of a Transportation Incentive Program for Affordable Housing Residents

In the seminar, Huiun Tan, Nathan McNeil and John MacArthur of PSU along with Roshin Kurian of PBOT will share findings from their survey of participants in PBOT's pilot program, and draw connections to how a transportation demand management program like the Wallet could be implemented to provide incentives and financial benefits to low-income populations.

ABOUT THE RESEARCH

New Mobility For All: Can Targeted Information And Incentives Help Underserved Communities Realize The Potential Of Emerging Mobility Options?

Nathan McNeil and John MacArthur, Portland State University

Photo by Cait McCusker

The Transportation Research and Education Center (TREC) at Portland State University is home to the National Institute for Transportation and Communities (NITC), the Initiative for Bicycle and Pedestrian Innovation (IBPI), and other transportation programs. TREC produces research and tools for transportation decision makers, develops K-12 curriculum to expand the diversity and capacity of the workforce, and engages students and professionals through education.

Authored by Mike McQueen and John MacArthur, Portland State University

Electric bikes (e-bikes) are quickly becoming common in U.S. cities and suburbs, but we still have a ways to go compared to our neighbors across the Atlantic.  In recent years, e-bike sales have steadily increased with unprecedented growth in Europe, especially in the Netherlands. Can the U.S. catch up? E-bikes offer a cheaper alternative to car travel and also provide physical activity. Riders with limited physical ability find that e-bikes extend their overall mobility. Beyond the practical, e-bikes are also just fun to ride. In fact, e-bikes encourage users to cycle farther and more often than conventional bicycles. More importantly to local and regional U.S. governments, e-bikes could be a useful tool to address our current climate crisis by reducing transportation greenhouse gas (GHG) emissions.

Related research: MacArthur and McQueen are also working with the National Science Foundation to collect e-bike user data via onboard technology. To learn more or participate in that study, visit the Mobility By E-Bike Project.

E-bike incentive programs in the U.S. remain relatively small in scale. Currently, California and Oregon offer statewide incentive programs that provide rebates towards the purchase of battery electric vehicles (BEV), plug-in hybrid electric vehicles (PHEV), and fuel cell electric vehicles (FCEV). These programs are intended to reduce state GHG emissions from the transportation system. Could incentivizing e-bikes also be a cost-effective way for regions to reach their greenhouse gas emission reduction goals?

Today the Transportation Research and Education Center (TREC) at Portland State University launches a new Electric Vehicle Incentive Cost and Impact Tool. This online tool enables policymakers, public stakeholders, and advocates to quickly visualize the potential outcomes of an electric vehicle incentive program made up of several vehicle types. The tool estimates the cost efficiency of a proposed program in terms of the cost per kg CO2 avoided by each mode over the course of one year. It also takes the proposed budget into consideration to calculate the potential number of incentives to be made available and the amount of total CO2 that would be avoided due to internal combustion engine automobile (ICE) VMT displacement.

To show you how it works, we tried out the tool with Oregon as a case study. Currently, the state sets aside about $12M per year for its Oregon Clean Vehicle Rebate Program, with rebates usually offered at $2,500 each for BEV and PHEV vehicles with battery capacity of 10 kWh or more and $1,500 for vehicles with batteries with less than 10 kWh. How do BEVs, PHEVs, and e-bikes compare in terms of incentive program cost efficiency and greenhouse gas emissions avoided?

USING THE EV INCENTIVE COST AND IMPACT TOOL: AN OREGON CASE STUDY

Creating your EV Incentive Program

First, let’s get the tool set up with information for the state of Oregon. We’ve designed the tool with all of the data you need, and you simply choose the presets for your scenario. It’s also easy to use your own data by just entering it directly into the tool. Apply presets with information for the electricity generation emissions profile from the US EPA eGRID, average car travel information from the NHTS, and national ICE fuel efficiency information from the US Bureau of Transportation Statistics.

 [[{"fid":"4916","view_mode":"default","fields":{"format":"default"},"type":"media","field_deltas":{"19":{"format":"default"}},"attributes":{"class":"media-element file-default","data-delta":"19"}}]]

Next, apply some information about the vehicles you’re looking to incentivize. Again, we’ll just use presets that we’ve created: 

  • The E-Bike preset is an average of the fuel economies of several e-bike models studied in a recent paper by Efficiency Vermont. It may be unreasonable to expect most people to completely replace all of their automobile VMT with an e-bike. To account for this, we specify that the average user will only replace 15% of their VMT with their incentivized e-bike. 

  • The BEV preset is a weighted average of fuel economies provided by the US EPA of the current BEV fleet in Oregon. 

  • Similarly, the PHEV preset is a weighted average of fuel economies provided by the US EPA of the current PHEV fleet in Oregon. Fleet information was obtained from the Oregon Department of Transportation (ODOT) based on historical rebate distribution within the state.

[[{"fid":"4917","view_mode":"default","fields":{"format":"default"},"type":"media","field_deltas":{"20":{"format":"default"}},"attributes":{"class":"media-element file-default","data-delta":"20"}}]]

Lastly, we can set our incentive amounts and total budget. We can also choose how to distribute our budget among the vehicles we’re incentivizing. Let’s set the BEV and PHEV incentive to $2,500 and the total budget to $12M, similar to Oregon’s current program. We’ll try out an e-bike incentive of $350, and for this example we’ll split the budget evenly among each vehicle type.

[[{"fid":"4901","view_mode":"default","fields":{"format":"default"},"type":"media","field_deltas":{"4":{"format":"default"}},"attributes":{"class":"media-element file-default","data-delta":"4"}}]]


Once you’re all done creating your incentive program scenario, you can export a report for quick reference when discussing options with other stakeholders.

Review the Results: What did we find in Oregon?

First off, we get some information about incentive cost efficiency. It turns out that the e-bike incentive is more cost efficient, in terms of cost per kg CO2 saved, than both the BEV and PHEV incentives.

[[{"fid":"4902","view_mode":"default","fields":{"format":"default"},"type":"media","field_deltas":{"5":{"format":"default"}},"attributes":{"width":"600","class":"media-element file-default","data-delta":"5"}}]]

[[{"fid":"4904","view_mode":"default","fields":{"format":"default"},"type":"media","field_deltas":{"7":{"format":"default"}},"attributes":{"class":"media-element file-default","data-delta":"7"}}]]

Next, we can look at the total number of incentives our program is able to provide. Because the e-bike incentive is much lower in price, the program is able to impact almost 10 times as many people’s lives with a new e-vehicle compared to the BEV or PHEV incentives given our $12M budget.

[[{"fid":"4903","view_mode":"default","fields":{"format":"default"},"type":"media","field_deltas":{"6":{"format":"default"}},"attributes":{"width":"600","class":"media-element file-default","data-delta":"6"}}]]

[[{"fid":"4905","view_mode":"default","fields":{"format":"default"},"type":"media","field_deltas":{"8":{"format":"default"}},"attributes":{"class":"media-element file-default","data-delta":"8"}}]]

Lastly, let’s look at the GHG impacts of our program over the course of 1 year. The program is able to reduce the amount of CO2 emissions of one year by about 25M kg thanks to the incentive program we designed. Given how we’ve structured this incentive program, e-bikes make up the largest portion of this CO2 savings, about 40% of the entire impact.

[[{"fid":"4906","view_mode":"default","fields":{"format":"default"},"type":"media","field_deltas":{"9":{"format":"default"}},"attributes":{"width":"600","class":"media-element file-default","data-delta":"9"}}]]

[[{"fid":"4907","view_mode":"default","fields":{"format":"default"},"type":"media","field_deltas":{"10":{"format":"default"}},"attributes":{"width":"600","class":"media-element file-default","data-delta":"10"}}]]

“What-if” Scenarios for E-bike Incentive Amounts

Let’s do a quick set of “what-if” scenarios to see how changing the e-bike incentive from $350 impacts the results.

What if the e-bike incentive was $150?

What we found for a $150 e-bike incentive (versus $350):

  • The cost per kg of CO2 saved has decreased, from $0.40 to $0.17.
  • The number of e-bike incentives we can offer has more than doubled, from 11,314 to 26,400.
  • Similarly, the amount of CO2 avoided due to e-bikes has also more than doubled, from 10.2M kg to 23.9M kg. This accounts for 61% of the total CO2 savings in this case.

What if the e-bike incentive was $500?

What we found for a $500 e-bike incentive (versus $350):

  • The cost per kg CO2 saved has gone up from our initial case study, from $0.40 to $0.55 per kg CO2 saved. However, this is on par with the cost efficiency of the PHEV incentive.
  • The number of e-bike incentives that can be offered has decreased, from 11,314 to 7,920. However, we’re still able to offer more incentives than the BEV and PHEV incentives combined.
  • Lastly, the total CO2 saved has also declined, from 10.2M kg to 7.2M kg, although it is still on par with the BEV and PHEV categories.

Final Thoughts

This case study has shown that e-bikes could be a strong player as part of a CO2 avoidance e-vehicle incentive program. In some cases, e-bikes could perform better than electric vehicles in terms of cost efficiency, number of incentives provided, and total CO2 saved.

The Electric Vehicle Incentive Cost and Impact Tool is available online, and is able to generate a downloadable report for sharing purposes.

Contact John MacArthur (macarthur[at]pdx.edu) with any questions or comments about the tool, and let us know how you used it!

ABOUT THE AUTHORS

John MacArthur

Sustainable Transportation Program Manager

John MacArthur is the Principal Investigator for TREC's electric bicycle research initiatives. His research also includes low-/no-emission vehicle infrastructure in Portland metro, as well as a climate change impact assessment for surface transportation in the Pacific Northwest and Alaska. Before joining the TREC staff, John was the Context Sensitive and Sustainable Solutions Program Manager for the Oregon Department of Transportation’s OTIA III State Bridge Delivery Program.

Mike McQueen

Graduate Research Assistant

Mike McQueen is a second year master's student working with John MacArthur of TREC and Dr. Kelly Clifton of the MCECS Department of Civil and Environmental Engineering. Currently, Mike is researching e-bike travel behavior and micromobility as an Eisenhower Fellow. In the past, he has studied e-bike purchase incentive programs, the potential positive environmental impact of e-bikes in Portland, BIKETOWN, and the demographics of zero car households.

The Transportation Research and Education Center (TREC) at Portland State University is home to the National Institute for Transportation and Communities (NITC), the Initiative for Bicycle and Pedestrian Innovation (IBPI), and other transportation programs. TREC produces research and tools for transportation decision makers, develops K-12 curriculum to expand the diversity and capacity of the workforce, and engages students and professionals through education.

Researchers
macarthur@pdx.edu