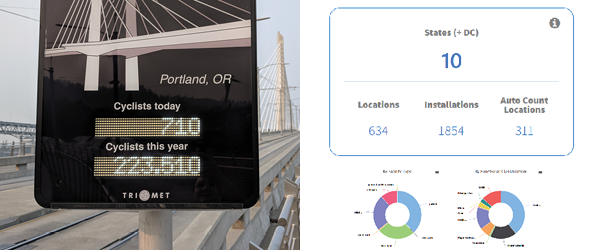
The New BikePed Portal Dashboard: A National Non-Motorized Count Data Archive

A national non-motorized count data archive, BikePed Portal provides a centralized standard count database for public agencies, researchers, educators, and other curious members of the public to view and download bicycle and pedestrian count data. It includes automated and manual counts from across the country, and supports screenline and turning movement counts.
BikePed Portal was established in 2015 by Transportation Research and Education Center (TREC) researchers at Portland State University through a pooled fund grant administered by the National Institute for Transportation and Communities (NITC). Other project partners include the Federal Highway Administration, Oregon Department of Transportation, Metro, Lane Council of Governments, Central Lane MPO, Bend MPO, Mid Willamette Valley Council of Governments, Rogue Valley Council of Governments, City of Boulder, City of Austin, Cycle Oregon, and Oregon Community Foundation.
If you’re interested in using BikePed Portal for archiving bicycle and pedestrian counts for your community, please contact us at bikepedportal@pdx.edu.
Hau Hagedorn, associate director of TREC, has been a driving force behind BikePed Portal since its conception. In early 2018 data scientist Tammy Lee joined TREC to manage our transportation data program. A primary focus of her role at TREC is the continued development and implementation of BikePed Portal, and she’s written quite a few case study blogs using BPP. Celebrating the launch of the new dashboard, we interviewed Hau and Tammy to learn more.
Before we jump into discussing BikePed Portal, could you share why access to better quality bike and ped data is so important for the transportation industry?
HAU HAGEDORN (ASSOCIATE DIRECTOR, TREC at PORTLAND STATE)
In general, data is powerful in decision-making. Agencies need to know how many people are biking and walking. How many trips happen per year? Per facility? What does that look like over time? Site by site, trail by trail, system by system. Accurate, centralized data (or, lack of it) can make or break the case for building or enhancing bike and walk facilities. Right now, the lack of significant data is a barrier. One thing that we hear a lot in pedestrian studies is ‘people don't actually walk there, we never see them.’ When you actually do the work and go out and count, intersections or segments or facilities, it becomes apparent that people are using it beyond expectations. In active transportation, we are always trying to play catch-up to the levels of vehicle data that is collected and analyzed. Beyond application for case studies, data like this is critical to advancing active transportation research scope and impact. The NCHRP released some great guidance, the Guidebook on Pedestrian and Bicycle Volume Data Collection that also details some use cases across the U.S.
USE CASES FOR BICYCLE AND PEDESTRIAN COUNT DATA IN A NATIONAL ARCHIVE
Understand how existing infrastructure is used: How many trips per year happen on a facility? Show changes over time, site by site, trail by trail, system by system.
Demonstrate impacts with before/after studies: Communicate how funds have been used, and evaluate the effects of new infrastructure on pedestrian and/or bicycle activity.
Tell the story: Share count data in infographics, articles, grant reporting, and annual reports while answering how people are using the system and how it’s grown.
Guide prioritization: There is potential to use data for system planning, as well as prioritize where needs are, particularly for bike-ped projects.
Make the case: Use data to support grant applications and validate identified needs.
Change design: Using volume, a shared use path LOS calculator could be used to determine how wide a facility should be designed or improved.
Improve data quality: Providing count device maintainer information about the quality of the data – both filtering “bad” data and letting the maintainer know when a device may be broken.
Increase access and ease of data: Support data requests automatically so staff don’t have to individually respond to data requests.
Your team developed BikePed Portal – a central data repository for national bike and ped data. Why is this significant?
TAMMY LEE, Ph.D. (TRANSPORTATION DATA PROGRAM ADMINISTRATOR, TREC at PORTLAND STATE)
Most often agencies have a lot of count files of all different types, and they're all siloed on different computers, different machines. There isn’t consistency in how those data files are maintained, stored, or created. It can be overwhelming. So using a central data repository is an opportunity for agencies to standardize their data and store it in one shared location. That way, it's just not sitting on someone's computer but instead accessible by multiple people within an organization.
What is unique about BikePed Portal compared to what else is out there? Is there a feature you are most excited about?
HAU
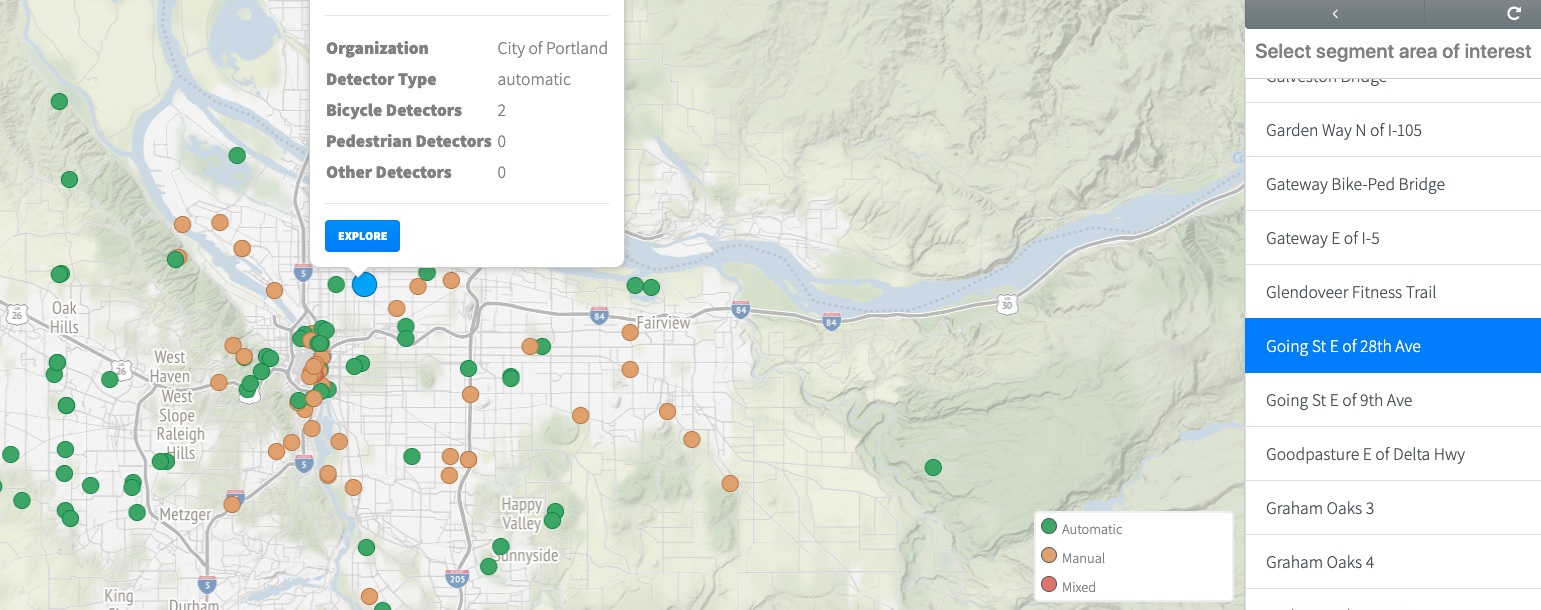
U.S. cities and jurisdictions collect data for their specific entity, which means you have to go to various sites to compare the volumes of walking and biking across a state or the country. In the BikePed Portal dashboard that comparison is easier, especially with the performance measures we have set up. For example, within the Portland region, we have Metro collecting count data, we have the City of Portland collecting counts, the Tualatin Hills Park & Recreation District, City of Beaverton, as well as the state of Oregon. Once we get all of that data into BikePed Portal, and these agencies authorize the view of that data, you have all of those disparate data sources in one place. It provides a more comprehensive view of what the actual volumes are across an entire network and system. I’m most excited about the potential for stronger coordination between these entities as they collaborate on infrastructure projects and other types of active transportation programs and planning.
Who are the intended users of BikePed Portal?
TAMMY
U.S. transportation agencies, planners, and advocates who need bike/ped counts, as well as those in academia like students, researchers, and educators. Right now you can download the hourly data we have by site. There are a few sites that have years and years worth of data, which is pretty impressive for a long-term dataset. If you're a researcher, and you're trying to figure out which city or which jurisdiction has the most data, you can just poke around BikePed Portal. It saves that researcher the time and frustration of having to reach out to different cities asking, does this data exist? Can I access this data? And, once they receive the data, it's all standardized and easy to use. Versus if they had reached out to those agencies, they’re going to get some text files, csv files, handwritten pdfs, machine unreadable Excel files.
Last year we released research on bike and ped count data QA/QC from Portland State researcher Nathan McNeil. How important was this QA/QC process to the design and function of BikePed Portal?
TAMMY
We make it a point to ingest different types of data sources and put them together all in one location. You can have counts from EcoCounter, from different makers like Traffix, and manual counts, and it all gets inputted into BikePed Portal. And so because of that, and because we have a nice database in which to do it, we're able to use this really large and diverse sample size to do an analysis developing QA/QC metrics. Count data can have some really large peaks. For example in Portland, there's the World Naked Bike Ride Day - it’s huge. That day would automatically get flagged for the data owner because the volume is so high. But the data owner is given the choice to validate or invalidate it. They know their data better than any outsider. That validation process helps researchers and others who download the data; they can check, was this data QA/QC'd by the owner? If it wasn't, then they can have that chance to sort of validate it themselves and figure out if they want to use it or not.
What's next? Is there another evolution or feature in the works?
HAU
Our next goal is really broadening the user base and expanding the datasets available in BikePed Portal. Also, we’re really focused on integrating AADNMT calculations (Annual Average Daily Non-Motorized Traffic). For cities that meet a certain volume of counts, we will be providing that metric. Just like with traffic data, this gives you a sense of the volume of usage for your analysis area. If anyone is interested in learning more about BikePed Portal and how they can use it for archiving bike and pedestrian counts for your community, they can reach out to us at bikepedportal@pdx.edu.
RELATED RESEARCH
To learn more about this and other TREC research, sign up for our monthly research newsletter.
- Online Non-motorized Traffic Count Archive
- Biking and Walking Quality Counts: Using “BikePed Portal” Counts to Develop Data Quality Checks
- BikePed Portal Phase II
The Transportation Research and Education Center (TREC) at Portland State University is home to the National Institute for Transportation and Communities (NITC), the Initiative for Bicycle and Pedestrian Innovation (IBPI), and other transportation programs. TREC produces research and tools for transportation decision makers, develops K-12 curriculum to expand the diversity and capacity of the workforce, and engages students and professionals through education.

