
Visualizing better transit decisions: TRB 2014
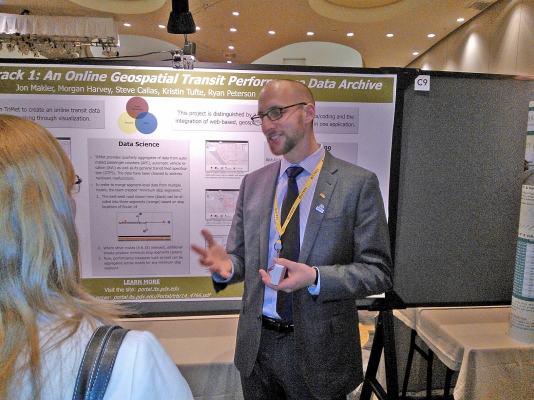
A new tool added to Portland State University's regional transportation data archive can help transit agencies and riders alike make better decisions. The Portland State-based team presented its work at the Transportation Research Board annual meeting Monday in Washington, D.C.
The team worked with the Portland regional transit agency, TriMet, to make the transit data richer and more useful. Starting with an offline, GIS-based protocol for mapping ridership and service metrics, the team developed an online, interactive map that offers myriad possibilities for users of all types.
Many applications offer schedule data for passengers or operational data for agencies, but none join both types of data in a customizable, Web interface, said project leader Jon Makler. "People would look at this and say, 'It would be amazing if we could put all of this stuff in the same system,'" Makler said. "But they see the work that it requires and they back away."
Here's one way the archive can help transit agencies: Managers receive complaints about bus crowding at certain times on certain routes. They ask an analyst to pull the data, and the analyst returns with a spreadsheet of arcane route and stop numbers. "The managers say, 'That doesn't mean anything to me,'" Makler said.
With the transit archive, those managers can now pull up a route map online and see all the segments that are orange or red, indicating crowding, and start looking for causes and planning solutions.
Team developer Morgan Harvey helped bring to life an idea to visualize the total number of riders on a segment, even if they're on separate buses. "At some point, it became obvious that that had to happen," Harvey said. "Where buses converge and diverge, you need to be able to add that to the segment; otherwise, it makes it impossible to aggregate."
Agency performance metrics are just the first use of the tool, Makler said. With the data available online as part of the Portal regional transportation archive, it can affect economic, land use and lifestyle choices. "How many people can get to a district in X minutes? How might adding transit affect job accessibility? Tools like this allow you to do that kind of analysis," he said.
Transit riders might use the information when deciding where to live or how to commute, Makler said. While transit districts often offer schedule data for riders, these are the hoped-for arrival times. The new tool allows users to see actual on-time performance or crowding and pick their routes accordingly.
