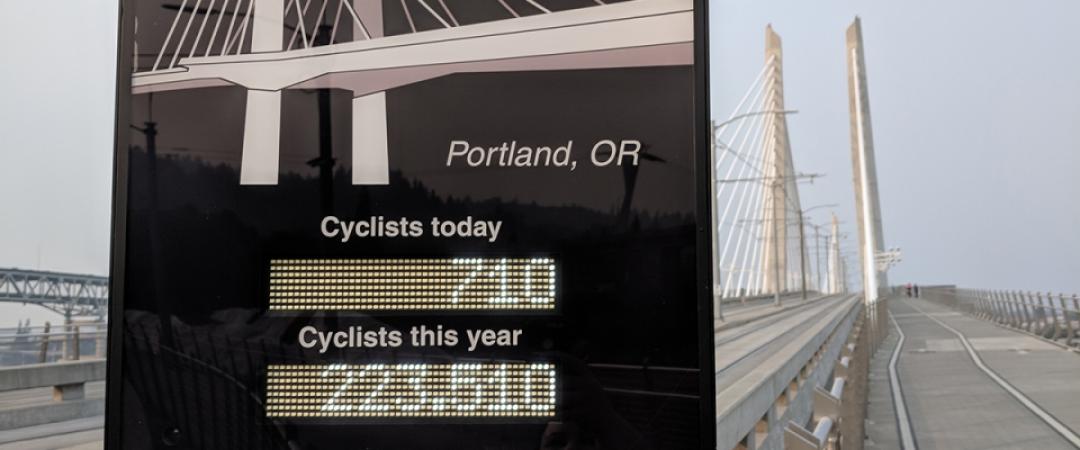
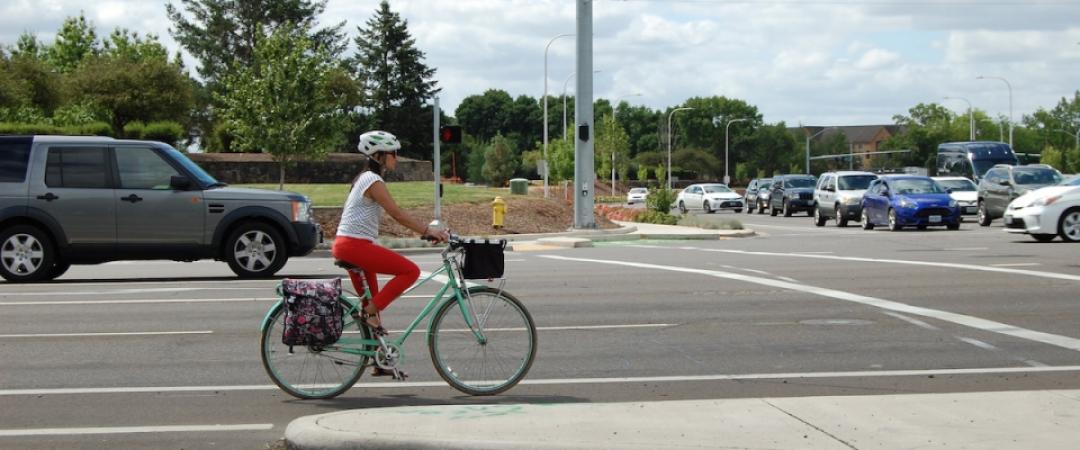
One of the most common locations for fatal motor vehicle–bicyclist crashes is at intersections. A newly published report offers guidance for improving intersection safety, especially in situations where a bike is traveling straight through an intersection and a car is turning across the cyclist's path.

The objective of the study was to develop guidelines and tools for transportation practitioners to reduce and manage conflicts between bicyclists and drivers turning at signalized intersections.

"Reducing Conflicts Between Turning Motor Vehicles and Bicycles: Decision Tool and Design Guidelines" was funded by the National Cooperative Highway Research Program (NCHRP), a program of the National Academies of Sciences, Engineering, and Medicine. The research was led by Toole Design in partnership with Portland State University (PSU), Safe Streets Research and Consulting (SS) and Oregon State University (OSU). The PSU team members were Chris Monsere, Sirisha Kothuri and Jason Anderson of the Maseeh College of Engineering and Computer Science, and Nathan McNeil of the Transportation Research and Education Center (TREC).

WHAT DID THE RESEARCHERS STUDY? 

The research team conducted crash analysis, video-based conflict analysis, and a human factors study to better understand the effects of known common risk factors. These known risk factors include vehicle volume, vehicle speed, and bicyclist volumes. They also evaluated the relative safety performance of five different intersection treatments: 

  1. Conventional bike lane at intersection,
  2. Separated bike lane at intersection,
  3. Pocket bike lane,
  4. Mixing zone, and
  5. Protected corner.
Intersections

While there are many other types of intersection treatments available, such as bike boxes, two-way separated bike lanes or shared-use paths, these five were selected for study based on critical knowledge gaps identified through a review of the existing research.

WHAT DID THEY LEARN? 

Based on the safety analysis, the researchers concluded the following for each intersection treatment:

Separated bike lanes and protected corners at intersections are the preferred treatments, with leading interval or full-phase signal separation in some conditions.

Conventional bike lanes at intersections are only recommended once practitioners have made every effort to reallocate space to provide a protected corner or a separated bicycle lane.

Pocket bike lanes are only recommended in limited situations.

Mixing zones are only recommended if right-turning motor vehicle volumes are high and practitioners have made every effort to reallocate space to provide a right-turn lane and a separated bicycle lane at the intersection.

HOW WILL THIS HELP IMPROVE SAFETY AT INTERSECTIONS?

The decision tool and supplemental design guidelines shared in this report provide an expanded framework for practitioners to assess trade-offs between various intersection treatments, and guidance to help them make decisions to manage conflicts between bicyclists and right-turning motorists. 

The Decision Tool

The tool, illustrated here as a flowchart, provides guidelines related to urban, suburban, and rural town center land-use contexts. It focuses on the primary risk factors most likely to affect safety outcomes for bicyclists.  

Flow chart of the decision tool. The text-based version of this can be found in the linked final report.

The Design Guidelines

In a set of supplemental design guidelines, the researchers provide recommendations for mitigating known safety concerns for each intersection treatment. The fourth chapter of the report includes comprehensive detail and discussion of each treatment.

These guidelines incorporate the safety performance of treatments, while considering bicyclists’ perceived comfort, which can affect if and where people will ride bikes. 

In order to effectively apply the decision tool and the guidelines, practitioners should have an understanding of several key concepts, including the Safe Systems Approach, which are discussed in detail in the chapter on Decision-Making Principles.

This report stands as a valuable resource for transportation practitioners who are seeking evidence-based guidance on how to create safer intersections.

Portland State University's Transportation Research and Education Center (TREC) is a multidisciplinary hub for all things transportation. We are home to the Initiative for Bicycle and Pedestrian Innovation (IBPI), the data programs PORTAL and BikePed Portal, the Better Block PSU program, and PSU's membership in PacTrans, the Pacific Northwest Transportation Consortium. Our continuing goal is to produce impactful research and tools for transportation decision makers, expand the diversity and capacity of the workforce, and engage students and professionals through education, seminars, and participation in research. To get updates about what's happening at TREC, sign up for our monthly newsletter or follow us at the links below.

 BlueSky  |  Instagram  |  LinkedIn  |  Facebook  |  TikTok  |  YouTube

Projects
1465
Researchers
monsere@pdx.edu
skothuri@pdx.edu
nmcneil@pdx.edu

In order to make sure bicyclists' needs are considered when improving a transportation system, planners and engineers need to know how many people are biking, and where. 

Traditional bicycle counters can provide data for limited sections of the bike network; often these counters are installed at important locations like trails or bridges. While limited in location, they count everyone who bikes by. Meanwhile, GPS & mobile data cover the entire transportation network, but that data only represents those travelers who are using smartphones or GPS. Combining the traditional location-based data sources with this new, crowdsourced data could offer better accuracy than any could provide alone. 

"Knowing how many people are bicycling on a street is really important for a number of reasons. As just a few examples, bicycle volumes give you a way to understand safety data and determine crash rates. They provide insight into where and how bicycle trips are taking place, which can help plan for new or improved facilities," said Nathan McNeil of Portland State University.

Supported by a pooled fund grant administered by the National Institute for Transportation and Communities (NITC), Dr. Sirisha Kothuri of Portland State University led a research project aimed at fusing traditional and emerging data sources together, to derive bicycle volumes for an entire transportation network. The team developed three models and tested them in six cities: Dallas, Texas; Portland, Bend and Eugene, Oregon; Boulder, Colorado; and Charlotte, North Carolina. Learn more about the project in this research highlight video.

Related research: This is one of many NITC studies advancing the collection, methodology, and analysis of multimodal data that supports professionals and researchers in understanding and predicting human travel behavior in order to optimize those systems for both the providers and users. Learn about more NITC research in the area of multimodal data and modeling.

DEVELOPING THREE BIKE COUNT MODELS

With Kothuri as principal investigator, the research team included Joe Broach and Nathan McNeil of PSU; Kate Hyun, Stephen Mattingly and Md. Mintu Miah of the University of Texas at Arlington; Krista Nordback of the University of North Carolina's Highway Safety Research Center, and Frank Proulx of Frank Proulx Consulting LLC. 

First, the team conducted a literature review while cataloging and evaluating the available third-party data sources and existing applications. They chose the six study sites to represent a variety of urban and suburban contexts, with plenty of geographical diversity, and existing bike data available. Of the six, Boulder, Charlotte and Dallas constituted basic sites, where one year of data (2019) was used for modeling. Portland, Bend, and Eugene in Oregon were considered enhanced sites, where three years of data (2017–2019) were used for model estimation. 

The team chose three relatively new data sources: Strava, Streetlight Data, and GPS data from bike share systems in the case study cities. After collecting demographic, network, bike count and emerging data from the new sources for each of the cities, they developed three sets of models: 

  1. One with pooled data from all six cities,
  2. another with just the pooled data from the three Oregon cities,
  3. and finally a set of city-specific models. 

The researchers then applied the results to each of the six study sites. The city-specific models generally performed the best, showing the most accuracy in predicting bicycle volumes. The scripts used to run the models will soon be published to GitHub, and a link will be posted on the project page for anyone interested in accessing the models.

In general, the various data sources appeared to be complementary to one another; that is, adding any two data sources together tended to outperform each data source on its own. Adding even more data should continue to refine accuracy. The findings from this study indicate that rather than replacing conventional bike data sources and count programs, big data sources like Strava and StreetLight actually make the old “small” data even more important.

"We will need more ground-truth counts for low-volume sites to capture the variety of locations, and that will make more robust models," said Kate Hyun of UTA.

BETTER MODELS PROVIDE MORE ACCURATE PERFORMANCE MEASURES FOR TRANSPORTATION AGENCIES

Josh Roll, Research Analyst & Data Scientist at the Oregon Department of Transportation, served as the chair for the project’s technical advisory committee. He believes the outcome of this research could help transportation agencies get a better handle on how many people are biking in their communities. 

“At ODOT we just adopted "Bicycle Miles Traveled" as a new key performance measure, and we need a way to measure it, so this project very much helps to fill the gap on how we're going to do that. This research used cutting-edge data fusion techniques that could lay the groundwork for how transportation agencies like ODOT monitor bicycle activity across the system,” Roll said.

For transportation agencies wishing to support active travel to meet various sustainability, public health, and climate-related goals, quickly having accurate data for the entire network would be a giant leap in the right direction.

Robust, organized, and accessible count programs will be essential to get the most out of emerging data sources. The more good, vetted data are available, the better models based on emerging sources will perform, so professionals managing bicycle count programs should focus on making data uniform and widely usable.

"In order to integrate all of these disparate data sources – automated and manual counts, opt-in apps like Strava, passively collected background data like Streetlight, and GPS-enabled bike sharing systems — into one coherent system, data professionals should organize their data to best take advantage of these new data fusion possibilities. This means making sure nonmotorized data are accurate, consistent, and useful," said Sirisha Kothuri, lead researcher on the project. 

ABOUT THE PROJECT

Exploring Data Fusion Techniques to Estimate Network-Wide Bicycle Volumes

Sirisha Kothuri, Joe Broach and Nathan McNeil, Portland State University; Kate Hyun, Stephen Mattingly, and Md. Mintu Miah of University of Texas at Arlington; Krista Nordback of the University of North Carolina's Highway Safety Research Center, and Frank Proulx of Frank Proulx Consulting LLC. 

This research was funded by a pooled fund grant through the National Institute for Transportation and Communities, with additional support from the Oregon Department of Transportation, Virginia DOT, Colorado DOT, Central Lane MPO, Portland Bureau of Transportation, District DOT, and Utah DOT.

Photo by Lacey Friedly

RELATED RESEARCH

To learn more about this and other NITC research, sign up for our monthly research newsletter.

The National Institute for Transportation and Communities (NITC) is one of seven U.S. Department of Transportation national university transportation centers. NITC is a program of the Transportation Research and Education Center (TREC) at Portland State University. This PSU-led research partnership also includes the Oregon Institute of Technology, University of Arizona, University of Oregon, University of Texas at Arlington and University of Utah. We pursue our theme — improving mobility of people and goods to build strong communities — through research, education and technology transfer.

Projects
1269
Researchers
skothuri@pdx.edu

The Impacts of the Bicycle Network on Bicycling Activity: A Longitudinal Multi-City Approach

Wei Shi, Portland State University

In active transportation research, plenty of attention has been given to how different types of bike infrastructure affect people's likelihood of biking. Research has demonstrated that protected bike lanes encourage more people to bike than simple painted lanes, and that most cyclists feel safer riding through a protected intersection as opposed to navigating shared space with cars. However, relatively few empirical studies have investigated how holistically connected an entire bike network is, and how different populations can be positively or negatively impacted in their decision to bike by that level of connectivity.

Wei Shi, a recent Portland State University graduate with a PhD in urban planning, wrote her doctoral thesis on "The Impacts of the Bicycle Network on Bicycling Activity: a Longitudinal Multi-City Approach." In her work she found that a well-connected bicycle network - not individual bike lane segments or intersections, but the overall connection between places - is a big factor in people’s decision to bike. This is especially true for disadvantaged populations, including females and low income families.

HOW DID THE RESEARCH DETERMINE THIS?

Theoretically, a complete bicycle network is more than the sum of its parts. Its total impact on cycling is expected to be greater than the combined impacts of each segment. Working with her PSU faculty advisor, Jenny Liu, Shi started by identifying metrics to measure the connectivity of a network. Her dissertation includes a comprehensive literature review considering all the ways researchers have proposed to measure bicycle networks. For her study, Shi ultimately chose a method developed by Peter Furth of Northeastern University. Furth's model for measuring the connectivity of low-stress bicycle networks offers a classification of different types of street connections by their stress level, from 1 (suitable for children) to 4 (only 2-3% of cyclists willing to ride). In the final report, pages 25–31 and 47–53 illustrate the detailed bicycle network metrics Shi designed for the study.

Next, Shi used publicly available OpenStreetMap (OSM) data to measure the bicycle networks in two cities – Portland and Minneapolis. Why those cities? There was plentiful and relatively high quality bike count data available for both. The completeness of OSM data has been increasing each year, and future researchers can benefit from the successful demonstration of this methodology.

For both cities, Shi used bike count data to measure cycling activity, and open-source data plus additional supplementary data to measure three major types of bicycle infrastructure: on-street bike lanes, bike boulevards, and off-street paths. Using Furth's criteria she measured distance, stress along the route, and in general how easy it was to travel from one point to another along the bike network. Once she had evaluated a network for its connectivity and ease of use, she looked at the bike count data to see that network's impact on, and relationship to, bike ridership.

FINDINGS FROM PORTLAND AND MINNEAPOLIS

Both cities showed an improvement in level of traffic stress (LTS) between 2011 and 2017. In Portland, the major changes occurred in the far east Portland, northeast, and southern downtown areas of the city. These were the areas with significant infrastructure investments during the six years. These included the opening of the car-free Tilikum Crossing bridge, and bike boulevard construction in the southeast areas. The percentage of high-stress street segments decreased from 45% to 43%.

The City of Minneapolis also invested in new bicycle infrastructure during the past decade. The major changes happened in the downtown area. For example, protected bike lanes were constructed along two river-crossing roads: Central Avenue and 10th Avenue SE, around the University of Minnesota. In addition, bike lanes were installed across the city on arterials and major streets such as Central Avenue North and Lyndale Avenue North. The percentage of high-stress street segments decreased from 18.4% to 15.9% between 2011 and 2017.

The study found that the low stress bicycle network was associated with high bicycle ridership and high probability of choosing bikes among other travel modes, after controlling for other variables. In particular, the low-stress catchment area significantly affected bike counts in both case cities, indicating the importance of the extensiveness of the bicycle network in promoting bicycling activity. Increasing the reachable area via a low-stress-only network from a bike counter location by 1 square mile was associated with a 10% increase in bicycle volume in Portland, and a 14% increase in Minneapolis.

THE CONNECTION BETWEEN SOCIAL EQUITY AND BICYCLE NETWORKS

To determine if a well-connected bicycle network would especially benefit disadvantaged populations, Shi used one year of travel survey data in Portland from the Oregon Household Activity Survey (OHAS). She separated the data by gender, and found that the bicycle network influenced the female group more significantly. By increasing one unit of the low stress level metric along the travel route, the relative probability of choosing cycling than other modes was 26% higher for females. However, the same change in travel route didn't have significant impacts for males on choosing cycling compared to other modes. In other words, a connected network encourages women to bike more frequently.

In addition to gender, Shi also explored income level. She divided the population by income and found that the low-income population cares more about whether the bicycle network is holistic or not. In particular, increasing one unit of the low stress level metric along travel routes was associated with a 76% higher relative probability of choosing cycling compared to other modes for the low-income group, while the impacts on high-income counterparts were not significant. In other words, a better-connected network would make low-income travelers more likely to choose biking, while for high-income residents, this trend does not exist. It’s important to note that not having safe bike lanes to ride in leads to more frequent dangerous interactions between cyclists and motorists, and that has led to more confrontations with police. The holistic connectivity of that bike route takes on new significance when we consider barriers to biking. (Watch a recent PSU Friday Transportation Seminar: Biking While Black.)

IMPACTS ON FUTURE RESEARCH

In addition to demonstrating a successful methodology that future researchers can build upon, Shi's work also highlights the importance of accurate and open access data. 

"Having these data readily accessible for researchers and planners is essential. For cities that don't have these data, how can they even begin to measure the success of their investments in bikeway networks?" Shi said.

A lot of current research is focused on finding associations between ridership and network quality. In this dissertation, Shi was hoping to find some causal inference there: proof that the correlation between ridership and network quality is a cause-and-effect relationship. While this study did not prove that bike networks are the cause of increased ridership, she would like to see whether additional data, or another analytical approach, can further explore that point in the future.

IMPACTS ON PRACTICE AND POLICY

One of Shi's aims in conducting the study was to provide transportation professionals with concrete evidence that if they pay attention to connecting bicycle facilities, they can anticipate an increase in ridership. In particular, the improvements in bicycle networks would disproportionately benefit disadvantaged populations, such as female and low-income groups, by increasing their probability of riding bikes. If the goal is to achieve a certain mode share or certain active transportation goals, especially targeting disadvantaged population groups, this is some concrete evidence that connected networks can support that.

RELATED RESEARCH

To learn more about this and other Portland State University transportation research, sign up for our monthly research newsletter.

The Transportation Research and Education Center (TREC) at Portland State University is home to the National Institute for Transportation and Communities (NITC), the Initiative for Bicycle and Pedestrian Innovation (IBPI), and other transportation programs. TREC produces research and tools for transportation decision makers, develops K-12 curriculum to expand the diversity and capacity of the workforce, and engages students and professionals through education.

Researchers
shiwei@pdx.edu