posted by Anonymous on Tue, 05/26/2015 - 6:12am
I’ve been working through some survey data as part of a case study of the Portland Traffic and Transportation Course (https://www.portlandoregon.gov/transportation/35727), and thought I would share a few interesting differences that I’ve come across between course participants who commute via different modes.
As a bit of background, the course is a 10 week class jointly offered by Portland State University and the City of Portland that is open to the general public (not just PSU students) and provides a background in “local traffic and transportation issues, transportation options, and how to get things done in your neighborhood.” Being open to the public and providing a considerable depth of transportation-focused information, from history to engineering, the class is a relatively unique civic offering. The case study and an accompanying curriculum for other cities to implement a similar transportation-focused course will be completed in the coming months (more details are available at http://trec.pdx.edu/research/project/541/).
The data I’ve been working with came from a survey of graduates of the class (of which there are around 1200+ in Portland, from course sections going all the way back to the fall of 1991). The course includes, among other things, special guest presentations from transportation leaders and experts in Portland, a tour of transportation facilities, and a project asking students to identify a local transportation issue and propose a solution.
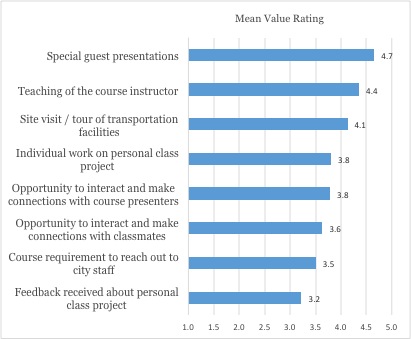
I can’t go through all the findings here, but want to discuss one section of the survey that asked respondents to rate the value they received from various course elements (the response scale ranged from (1): “not valuable at all” to (5): “very valuable” - respondents could also mark “N/A – I did not experience this item”). The mean value rating assigned by survey respondents for each element asked about are included in the chart below.
While the special guest presentations, teaching of the course instructor, and site visits were perceived as the most valuable elements of the course, I also found some interesting differences between groups of respondents based on what types of transport they use for commuting (see table below for commute mode use by survey respondents – as you can see, this group is very multimodal, with especially high rates of bicycling and transit use).
|
Some or Most Trips |
No Trips |
n |
|
|
Commute trips by car |
64% |
36% |
102 |
|
Commute trips by foot |
58% |
42% |
93 |
|
Commute trips by bike |
73% |
27% |
98 |
|
Commute trips by transit |
73% |
27% |
99 |
It’s worth noting here that in most cases, there were not significant differences between respondents who commute by different modes in how they rated different course elements. However, in some cases there were statistically significant differences worth noting (using an independent t-test). For example:
One of the more interesting differences is that course participants who make some or most commute trips by foot (we’ll call them “walkers” here) rated several course elements associated with the course project more highly than those who never commute by foot (“non-walkers”):
- Walkers rated the value of their work on their class project at 4.1/5 on average compared to 3.4/5 average for non-walkers;
- Walkers rated the value the course requirement to reach out to city staff, an element of the course project at 3.8/5 versus 3.2/5 for non-walkers; and
- Walkers rated the value of the feedback they received on the project at 3.3/5 versus 2.9/5 for non-walkers.
On the other hand, people who make some or most commute trips by bike (we’ll call them “bicyclists” here) valued the networking opportunities presented by the course more highly than those who never commute by bike (“non-bicyclists”):
- Bicyclists rated the opportunity to interact and make connections with course presenters at 3.9/5 compared to 3.4/5 for non-bicyclists; and
- Bicyclists rated the opportunity to interact and make connections with classmates at 3.9/5 compared to 3.2/5 for non-bicyclists.
Finally people who make some or most commute trips by car rated the site visit portion of the course more highly than non-car commuters (4.3/5 compared to 3.9/5); and, in an interesting contrast, people who make some or most commute trips by transit rated the site visits lower (at 3.9/5) than those who never commute by transit (4.5/5).
I’m not sure what it is about people who commute by foot that makes them value the course project assignment so highly. Similarly, I’m not certain why people who commute by bike get more out of the networking opportunity presented by the class (though, there could be a self-reinforcing element to this appeal), or why the site visit appeals to car commuters somewhat differently than transit commuters. I don’t have firm answers as to why these differences are showing up in the data, and should note that despite these differences, the top most valued course elements among all these groups remained the same (special guest presentations, teaching of the course instructor, and site visits). Still, I do find it interesting that the different aspects of the course appeal to different segments of the population.
Nathan McNeil is a research associate with the Nohad A. Toulan School of Urban Studies and Planning.

