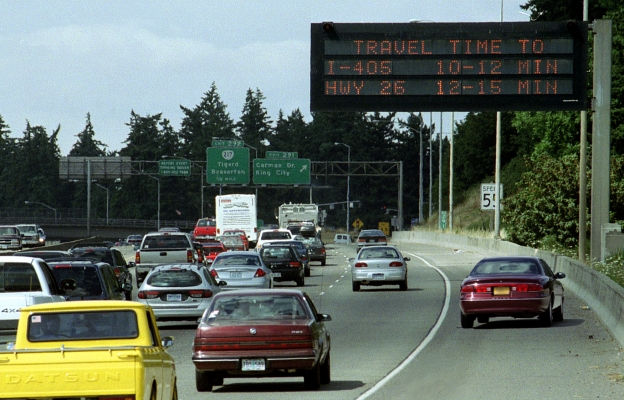
It’s a common occurrence: a digital signboard over the freeway tells you to expect a 15-minute trip, but traffic clears and you arrive in 10 minutes. Or, worse, you hit a clog and arrive in 30 minutes.

Sometimes those signboards, called dynamic message signs, are way off, Portland State University researcher Kristin Tufte found. But sometimes that doesn’t matter.

Tufte examined the signboards, called dynamic message signs, along Portland-area freeways in an OTREC project. Drivers typically reach their destinations earlier or later than the signs told them to expect when a so-called “shock wave” forms or dissipates; that is, when traffic suddenly bunches or clears up.

Currently, only three of the 30 or so message signs in the Portland metro area display travel times. Detectors at freeway onramps feed those signs. As a result, large swaths of freeway without onramps also have no data. To be most useful, new message signs would require more detectors in certain areas.

Take the busy Marquam Bridge in Portland, where busy freeways merge and there is no signboard. “There’s no detection for the whole length of the bridge,” Tufte said. “If you really want to have accurate travel times, you have to have detection there.”

As expected, Tufte found that traffic bunching or clearing in blind zones can throw off the accuracy of travel times displayed. Surprisingly, that inaccurate information is...

Read more
Even residents of a gingerbread candyland can't get around with holiday magic alone. After all, Santa's elves still need a reliable way to get from their cozy homes to the workshop.

Sadly, transportation planners have turned a frosty shoulder to sugar-based transit systems. Until now.

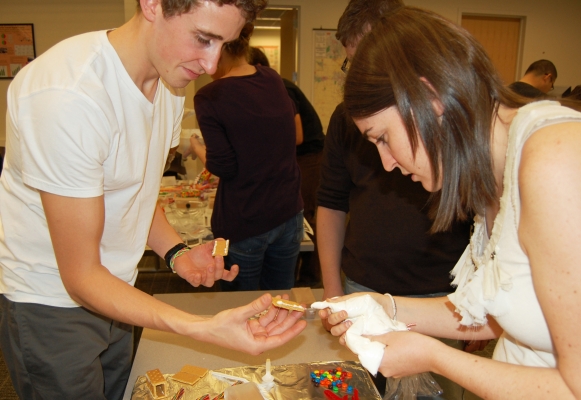
On Dec. 3, Portland State University's Students in Transportation Engineering and Planning held the first gingerbread transit station competition. Four teams of students pulled their attention away from human transit to focus on the needs of gingerbread people and misfit toys.

Dealing with building materials of unknown structural properties, students field engineered solutions. Licorice sticks stood in for steel rails, candy canes for bicycle racks. For a binding agent, students mixed cream of tartar and egg whites instead of portland cement.

The resulting transit system has already resulted in fewer traffic gum-ups and a drastic reduction in ultrafine powdered-sugar emissions. Sleigh-travel-time reliability has also improved.

Researchers are now assessing the durability of corn-syrup-reinforced composites in candy bridges, the potential for alkali-silica reaction in gingerbread pavement and the possibility that someone hungry will stumble in and eat the infrastructure.

The winning design team was Transit Wonderland, composed of Jesse Boudart, Sara Morrissey, Mark Haines and Meeyonwoo Lim.

Good transportation decisions rely on good models. Yet, despite advances in transportation modeling, there had been no dedicated training ground for the next generation of modelers. That all changed with the launch of the Oregon Modeling Collaborative Nov. 12. The collaborative will serve as a living laboratory to put the research from some of America’s top modelers into practice across Oregon.

On Nov. 12, we welcomed Peter Appel, administrator of the federal Research and Innovative Technology Administration, to Portland to kick off the collaborative with researchers, practitioners and policymakers from across the Northwest. Appel, confirmed by the U.S. Senate as administrator in 2009, has worked on U.S. Department of Transportation initiatives aimed at getting researchers and professionals to address safety, efficiency and environmental sustainability across all forms of transportation.

Groundbreaking research at the Oregon Transportation Research and Education Consortium has already produced models to account for bicycle trips and greenhouse gas emissions and to predict earthquake risk to highway bridges. However, models don’t do any good if agencies can’t afford the staff time and resources to use them. The Oregon Modeling Collaborative helps fill this gap by educating the next...

Read more

The video begins at 3:30.

Abstract: We all use abstractions of reality to help understand the world around us, synthesize knowledge, and to predict the consequences of our actions. These range from ad hoc mental models to highly complex mathematical creations. In this discussion we'll examine the motivations for building formal models, with particular focus on the types of models that will be explored in this course. Several different modeling approaches will be compared, along with the strengths and limitations of each. Some important questions that builders and consumers of models should ask will be covered, as well as ideas for building more useful and informative models. A discussion on how to judge the validity of a model will round out the discussion.

Speaker Bio: Rick Donnelly has over 25 years of experience in the modeling and simulation of transportation systems, from the urban to national level. His current interests include agent-based modeling of freight and logistics, integrated land use-transportation models, and dynamic network modeling. Rick leads the travel modeling and simulation practice at Parsons Brinckerhoff, an international civil and transportation engineering consultancy. He is also a senior fellow at the University of Melbourne, where he earned his doctorate in engineering, and a visiting scholar at Los Alamos National Laboratory.

Transportation mode choice is often expressed in terms of models which assume rational choice; psychological case studies of mode adoption are comparatively rare. We present findings from a study of the psychology of adoption for sustainable transportation modes such as bicycles, car sharing, and mass transit. Case studies were conducted with current and former participants in PSU’s ‘Passport Plus’ transit pass program, as well as a longitudinal cohort study of first-time winter bicycle commuters. Composite sequence analysis was used to construct a theory of the adoption process for these modes. Our findings suggest that mode evaluation is cognitively distinct from mode selection and has different information requirements. We conclude that public and private organizations could improve the adoption rate for these modes by tailoring their communication strategies to match the commuter’s stage of adoption.

View slides

The video begins at 9:01.

Watch video

View Kristi Currans's slides

View Steve Gehrke's slides

Steven Gehrke, Ph.D. Candidate, Portland State University

Topic: An Activity-related Land Use Mix Construct and Its Connection to Pedestrian Travel

Land use mix is a central smart growth principle connected to active transportation. This presentation describes the indicators of local land use mixing and their association with pedestrian travel in Oregon’s Willamette River Valley. It argues that land use mix is a multidimensional construct reflected by the complementarity, composition, and configuration of land use types, which is positively linked to walk mode choice and home-based trip frequency. Findings from this study underline the conceptual and empirical benefit of analyzing this transportation-land use interaction with a landscape pattern measure of activity-related composition and spatial configuration.

Steven Gehrke is a Ph.D. candidate in Civil and Environmental Engineering at Portland State University. His research examines the transportation-land use interaction,...

Read more

The video begins at 0:27.

View slides

Summary: The Transportation Planning Analysis Unit (TPAU) at ODOT helps to provide information to a large variety of transportation plans, projects, and policy questions.  This allows customers to make better informed decisions and to maximize limited resources.  In order to fill this role TPAU and the Oregon modeling community have a fairly large "toolbox" of models and analysis tools and procedures.  This transportation seminar will give an overview of the role and services that TPAU provides and the different tools and processes used to fulfill that role.

The video begins at 1:11.

Abstract: Metro's Transportation Research and Modeling Services Program's (TRMS) is responsible for the development, maintenance, and application of travel demand models for application in long-range planning efforts in the Portland metropolitan region. Representation of traffic -- both vehicular and transit -- plays an integral role in the travel demand modeling process. Complex software is required to assign vehicles and transit users to transportation networks to determine viable options available to travelers, costs associated with those options, and sets of routes by which travelers might navigate their trips. TRMS's current static assignment model has traditionally sufficed for use with Metro's four-step travel demand model. However, static assignments have well documented limitations that preclude the ability of the analyst to answer complex policy questions, especially those related to green house gas emissions, congestion, and transportation network reliability. In addition, static assignments cannot fulfill a need for small duration travel time increments required by the next generation activity-based models. The shortcomings of the static assignment necessitates TRMS's development of regional dynamic traffic assignment (DTA) models. The resolution of these models allows for continuous modeling of traffic over an analysis period, which allows the analyst to capture...

Read more

Watch video

View Nicholas Stoll's presentation slides

View Nicholas Kobel's presentation slides

Nicholas Stoll, Graduate Research Assistant, Portland State University

Topic: Utilizing High Resolution Bus GPS Data to Visualize and Identify Congestion Hot-spots in Urban Arterials

The research uses high resolution bus data to examine sources of delay on urban arterials. A set of tools were created to help visualize trends in bus behavior and movement, which allowed for larger traffic trends to be visualized along urban corridors and urban streets. By using buses as probes and examining aggregated bus behavior, contoured speed plots were used to understand the behavior of roadways outside the zone of influence of bus stops. These speed plots can be utilized to discover trends and travel patterns with only a few days’ worth of data. Congestion and speed variation can be viewed by time of day and plots can help indicate delays caused by intersections, crosswalks, or bus stops.

This type of information is important to transit authorities looking to improve bus running times and reliability. Congested areas can be detected and ranked. Speed plots...

Read more

Pages