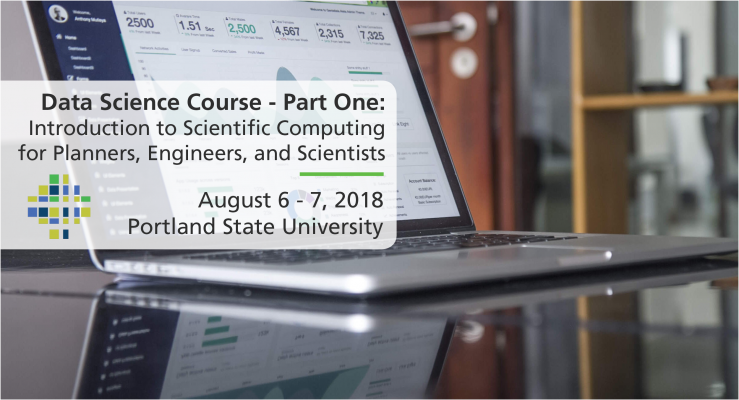
Join us for a three day introductory in-person workshop on databases and SQL

June 17, 18, and 20, 1:00 pm - 4:30 pm

Each day will be a combination of a lecture and practical. We will cover:

  • Introduction to relational databases.
  • Structured query language (SQL).
  • How to setup a PostgreSQL database on your local machine and use it to analyze data.

Software Requirements

You will be expected to bring your own laptop and have all required software installed prior to the workshop. If you are using a work-issued laptop, you will most likely need administrator privileges to install the following required software:

REGISTRATION

General: $325
Non-profit and community-based organizations: $125
PSU Students: $10 

PROFESSIONAL DEVELOPMENT

This three-day workshop is eligible for 9 hours of professional...

Read more

The video begins at 2:34.

View slides

Other presentation materials: Handout (PDF)

Summary: The recent City Club report on bicycling provided an opportunity to collect and analyze a number of data sets including the new Hawthorne Bridge data. One question is where Portland bicycling on the logistic curve -- a common tool for judging the maturity of a developing product or activity. Logistic curves are used for marketing, for epidemiology, and even for visits to Indian owned casinos. The preliminary evidence is that we are reaching the horizontal area of the curve. Additional evidence Our further research into future policies indicates a shift to bicycle boulevards in order to attract more risk averse riders.

Bio: Robert McCullough is an energy economist (and an adjunct at PSU) who has written, talked, and testified on energy issues across the U.S. and Canada. He was instrumental in the identification and prosecution of Enron's energy traders. He also works with aboriginal groups in Quebec and Oregon, activists in California and Ohio, as well as many others. His most recent project is the economic review of the WNP-2 nuclear station for Physicians for Social...

Read more

Watch video

View slides

ORcycle is a new smartphone application (for both Android and iOS) developed by Transportation, Technology, and People (TTP) lab researchers at Portland State University as part of an Oregon Department of Transportation (ODOT) research project. ORcycle collects user, route, infrastructure, crash, and safety data. ORcycle was successfully launched in early November 2014 and presents many improvements over existing or similar apps. Initial data findings and insights will be presented. Lessons learned as well as opportunities and challenges associated with smartphone data collection methods will be discussed. More information about the app can be found here: http://www.pdx.edu/transportation-lab/orcycle

Read more

Watch video

View slides

Light detection and ranging (LIDAR) technology is reshaping the civil engineering profession and offers many unique advantages. National efforts such as the 3D Elevation Plan (3DEP) are helping increase the availability of LIDAR data. LIDAR is one of the crucial technologies that is transitioning the world of civil and construction engineering from 2D paper-based design to 3D digital design. The high spatial resolution and accuracy capabilities of LIDAR have led to increased efficiencies, improved analyses, and more informed decision making.

A further advantage of this dataset is that multiple people can use the same dataset for a variety of purposes across multiple disciplines. The visual nature of the dataset also is more intuitive than traditional data acquisition and analysis techniques. This presentation will provide a brief background of LIDAR , its capabilities, limitations and platforms, and discuss its current and future role in civil engineering. Examples of a wide range of transportation, geotechnical, coastal, and structural engineering, science, and planning applications will be presented including development of mobile LIDAR guidelines for...

Read more

The video begins at 2:25.

View slides

Topic: Using "big data" for transportation analysis: A case study of the LA Metro Expo Line

Summary: Access to a comprehensive historical archive of real-time, multi-modal multi-agency transportation system data has provided a unique opportunity to demonstrate how “big data” can be used for policy analysis, and to offer new insights for planning scholarship and practice. We illustrate with a case study of a new rail transit line. We use transit, freeway, and arterial data of high spatial and temporal resolution to examine transportation system performance impacts of the Exposition (Expo) light rail line (Phase 1) in Los Angeles. Using a quasi-experimental research design, we explore whether the Expo Line has had a significant impact on transit ridership, freeway traffic, and arterial traffic within the corridor it serves. Our results suggest a net increase in transit ridership, but few effects on traffic system performance. Given the latent travel demand in this heavily congested corridor, results are consistent with expectations. The benefits of rail transit investments are in increasing transit accessibility and person throughput within high-demand corridors; effects on roadway traffic are small and localized. 

Bio: Mohja Rhoads...

Read more

Join us for a three day introductory in-person workshop on R

September 10–12, 9:30am - 4:30pm

Tired of finding errors in your spreadsheets that perpetuate and cascade through your work? Still trying to cram “big” data into tiny worksheets? Wish you had an easier way to easily share data and results with others? Want to better manage and maintain your workflow? Always wanted to learn R and version control but never found the time? If any of your answers are yes, then this course is for you!

After several years of hiatus, we are excited to host an "Intro to R" workshop where we will cover the following:

  • Coding and scripting basics
  • Intro to data wrangling and visualizations
  • Version control & best practices
  • Where to go for help and how to expand your skills

Prerequisites for the Workshop

Basic knowledge and experience working with quantitative data; experience and skills in a different programming language or data processing and statistical software is helpful but not required.

Course Requirements

Please bring your own laptop and have the following software installed prior to the workshop. If you are using a work machine, please make sure you have reached out to your IT department to have these programs installed:

Read more

Watch video

This paper uses econometric techniques to examine the determinants of vehicle miles traveled (VMT) in a panel study using data from a cross section of 87 U.S. urban areas over the period 1982-2009. We use standard OLS regression as well as two-stage least squares techniques to examine the impact of factors such as population density, lane-miles per capita, per capita income, real fuel cost, transit mileage, and various industry mix variables on VMT. We use a distributed lag model to estimate the long run elasticity of various factors on VMT driven.

Preliminary empirical results show the demand for VMT in urban areas is positively and significantly impacted by lane miles, personal income, and the percent of employment in the construction. Fuel price, transit use and population density are all found to be negatively related to VMT per capita. Consistent with results from earlier studies, we find the long run price elasticity of demand for VMT per capita is approximately five times larger than the short run elasticity.

Holding all factors constant, per capita VMT is found to differ significantly by region with VMT being higher the more western and the larger the population size of an urban area. Finally, we find that the industry mix or the urban area also has a significant impact on driving.

Watch video

View slides

New FHWA VMT Forecasts and Implications for Local Planning

or

Post-Apocalyptic Zombies Ate Oregon’s Post-Recession, ATR Regression

Where: Room 204 of the Distance Learning Center Wing of the Urban Center at PSU

A summary of FHWA’s new national traffic trends assessment will be presented, including discussion of varied factors influencing forward-thinking forecasts. Examples of Oregon statewide vehicle miles travelled (VMT) and historic traffic trends from ATR stations in the Portland urban region and greater Willamette Valley will be highlighted. VMT, population and income data will be noted with implications on local transportation planning.

Andrew is an associate with David Evans & Associates, Inc., with over 28 years of experience in multimodal transportation planning with emphasis on sustainable community and Complete Street policy and plan development. He focuses on developing multimodal transportation plans with context-sensitive street standards and policies that implement enhanced bicycle and pedestrian use and circulation. His area of expertise includes measured pedestrian-access-to-transit connectivity, the implementation of...

Read more

View slides

If you would like to receive continuing education credits such as PDH or CM, please make sure to complete this evaluation form once you've watched the entire video so that we have a record of your attendance.

Watch video:

Read more

Watch video

View slides

Topic: Airsage cell phone data and its application in travel modeling
Summary: As part of the initial phase of development for the Idaho Statewide Travel Demand Model, Parsons Brinckerhoff developed a base year auto and truck trip matrix using AirSage cell phone OD data, a statewide network in Cube, traffic counts, and origin-destination matrix estimation (ODME) procedures. To begin, the 4000+ statewide zone system was aggregated into a 700 super zone system for collecting the cell phone OD data. Next, the cell phone data was collected for the month of September 2013 for the following market segments: Average weekday resident HBW, HBO, NHB, and visitor NHB trips. The cell phone trips were then disaggregated to zones using each zone’s share of super zone population and employment. These initial trip matrices were assigned to the daily statewide network using free flow travel time for route impedance and iteratively adjusted to minimize the difference between the estimated link volumes and traffic counts by user class.

This iterative trip matrix balancing procedure, also known as ODME, converged nicely by user class and facility type and produced reasonable flows. The resulting trip matrix trip length frequencies matched fairly well with the...

Read more

Pages