TREC awards for 2017, 2018 and 2019 bike to work month

Authored by Tammy Lee, Transportation Data Manager, Portland State University

Traditionally, the month of May is Bike to Work Month. Last year this time, Oregon logged 179,177 trips for a total of 1,374,835 miles by 10,397 riders. And last year this time TREC was winning the PSU bike to work month department challenge. So what are we seeing in the data now?

For continuity from the last time we posted some bike volume observations, we’re again showing data from the Hawthorne Bridge and Tilikum Crossing (Figure 1) in Portland, Oregon. At the moment, daily volume across the Hawthorne Bridge remains relatively low. Typically we’d expect bike volumes across the Hawthorne would be higher in May, especially because if this were “normal” times we’d be competing in the Bike to Work Month challenge. Bike volumes across the Tilikum show higher volumes beginning in April, especially on the weekends since the March 23, stay-at-home order was issued.

...

Read more

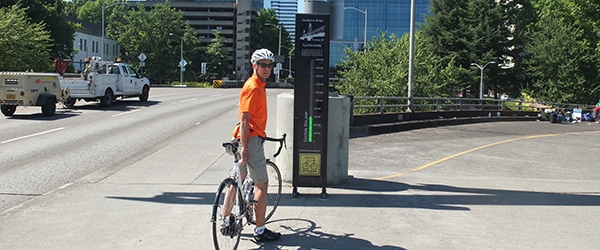
Cyclist stands next to the Hawthorne Bridge Bicycle Counter

Authored by Tammy Lee, Transportation Data Manager, Portland State University

For a deeper dive into bicycle volume data, watch the May 8 seminar with Tammy Lee and Kristin Tufte: Creating And Using A Publicly Available Multimodal Transportation Data Archive. Also, check out her earlier blog post on motor vehicle traffic volumes.

The weather these past few weeks has been beautiful: sunny, not too hot, not too cold, cherry trees blossoming… the ideal biking weather marred by a less than ideal pandemic.

Are social distancing measures affecting bike trips in Portland, OR? Maybe. Personally? Yes.

First, let’s get a few things out of the way before we provide summary observations:

  • Analyzing bike data is not as “easy” as evaluating vehicle traffic data: the infrastructure for monitoring bike (and pedestrian) data isn’t anywhere close to how vehicle traffic is monitored. There just aren’t many bicycle count detectors. So if one detector stops working then what little data that was available in the first place became that much littler.

  • ...
Read more
Cars on the freeway
Authored by Tammy Lee, Transportation Data Manager, Portland State University

For a deeper dive into vehicle volume data, attend the May 8 online seminar with Tammy Lee and Kristin Tufte: Creating And Using A Publicly Available Multimodal Transportation Data Archive. At this seminar, the presenters will offer an updated data analysis that reflects the latest vehicles volumes.

Ask most Portland drivers and they’ll tell you that traffic has gotten worse over the past 10 years. And data from the Oregon Department of Transportation supports that feeling.  

But for now, temporarily at least, all that is in the past.

The first confirmed case of COVID-19 in Oregon was February 28; a little over a month after the first positive test in the US. Since that week, many have noticed differences in traffic on our streets. An analysis of data from PORTAL - our multi-modal transportation data archive for the Portland-Vancouver metropolitan region - reflects that drop in traffic. 

A number of articles have been published describing the effects of social distancing policies in...

Read more
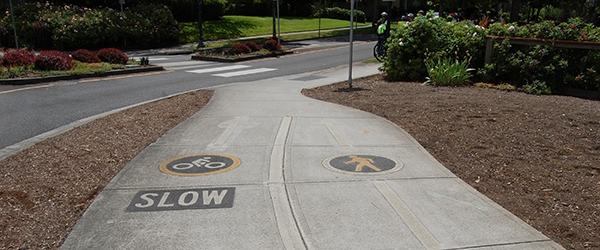
Street icons for bicycle and pedestrian
Photo by Cait McCusker
Nathan McNeil, Portland State University; Kristin Tufte, Portland State University

In the past decade bike and pedestrian count programs have sprung up all over the United States, gathering data to evaluate biking and walking infrastructure. However, these modes have not been studied with the quantitative rigor applied to motor vehicle travel. A research project funded by the National Institute for Transportation and Communities (NITC), led by Nathan McNeil of Portland State University (PSU), offers a method for monitoring the quality of this bike-ped count data.

... Read more
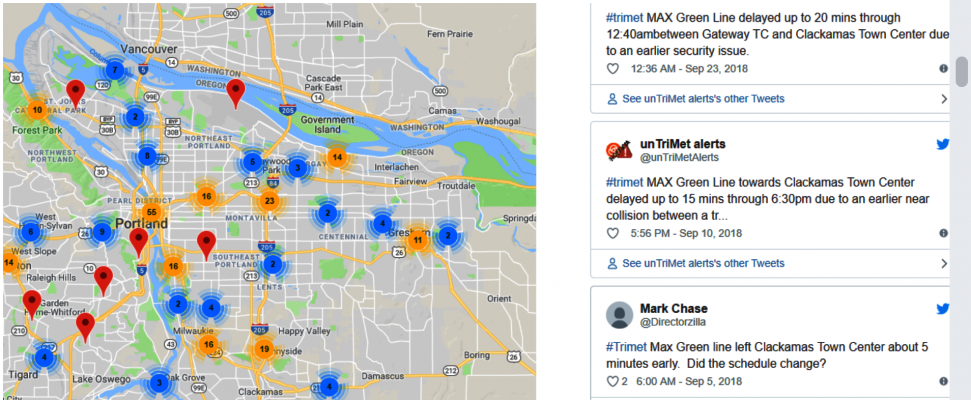
A screenshot from the STAT tool shows a map with embedded Tweets by location
Xiaoyue (Cathy) Liu, University of Utah; Ran Wei, University of California, Riverside; Aaron Golub and Liming Wang, Portland State University

With today's profusion of open data sources and real-time feeds, transit agencies have an unparalleled opportunity to leverage large amounts of data to improve transit service. Thanks to NITC researchers,...

Read more
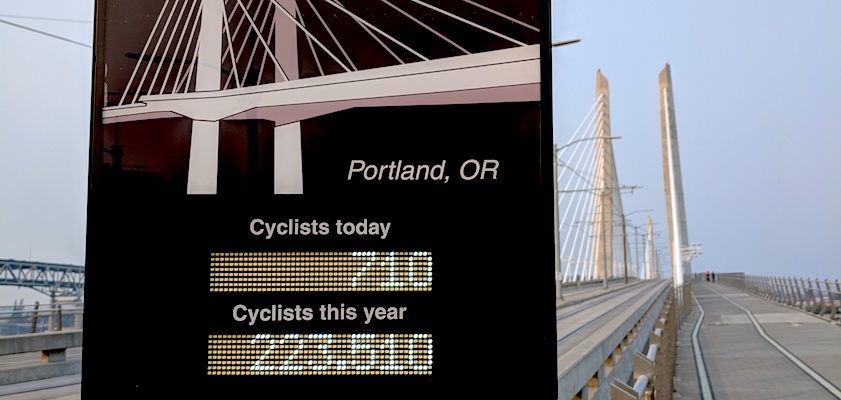
Automatic bicycle counter showing how many cyclists have passed today, and this year.
Principal Investigator:  Sirisha Kothuri, Portland State University
Learn more about this research by reading about the Pooled Fund research grant that started it, or the Project Overview page.

BIKE/PED COUNT SURVEY: CALL FOR INPUT

Researchers at Portland State University, University of Texas at Arlington, University of North Carolina at Chapel Hill and Toole Design Group are conducting a scan to identify locations where bicycle counts are taking place around North America, and hope to enlist your help! If you collect bike count data (or oversee counts) in your jurisdiction, please consider taking our quick survey to tell us a little bit about your count locations and data.

The survey can be accessed here: tinyurl.com/BikeCounterScan

THE NEW PROJECT

... Read more
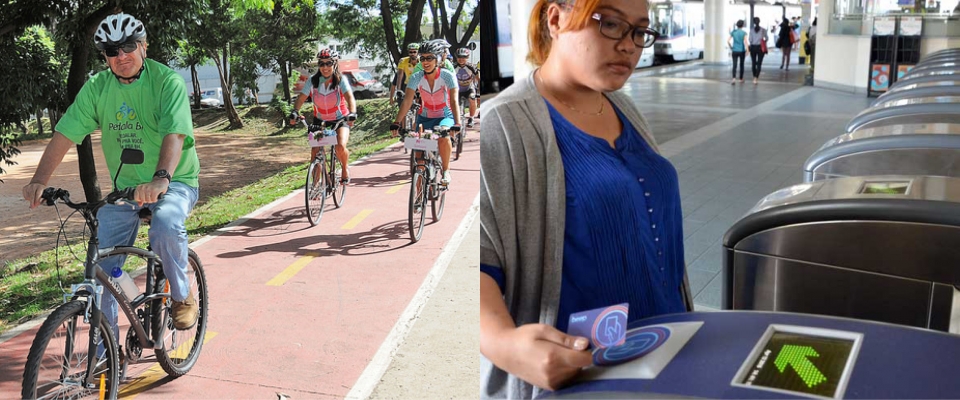
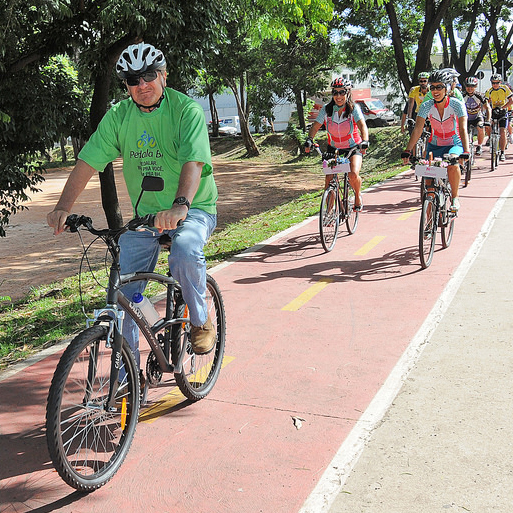
Left: Bicycles on a trail; Right: Young woman buying transit pass

The National Institute for Transportation and Communities (NITC) is soliciting proposals for our two 2018 Pooled Fund projects:

RFP now open; proposals due Oct 1, 2018

This project will address the need of cities and municipalities to combine bicycle data from different sources (such as manual counts, automatic counts, and crowd-sourced data from apps such as Strava) to assess an accurate accounting of bicycle traffic on a network. Current work on data fusion techniques is limited and additional research is needed to fully understand the choice of weighting techniques, inclusion of spatial vs. temporal variation in the...

Read more
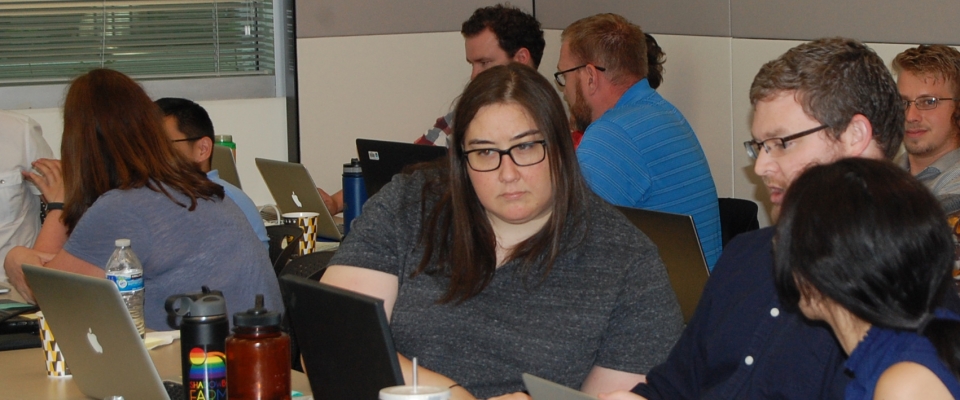
People looking at laptops
Principal Investigator: Liming Wang, Portland State University
Learn more about this curriculum and how you can apply it at your school by viewing the one-page Executive Summary and the full Final Report on the Project Overview page.

This course is being offered again April 3–10, 2019. Learn more and register here.


"Scientific Computing for Planners, Engineers, and Scientists," our data science course for transportation professionals, has completed its second year and continues to help planners and engineers improve their data processing workflows.

Taking an ocean of numbers and converting it into compelling infographics, charts and narratives that communicate results is a key part of the transportation profession, and a daunting challenge. That's why we created this week-long data science course. It's also why we're offering a one-day workshop that focuses specifically on transportation...

Read more
Principal Investigator: Liming Wang, Portland State University
Learn more about this curriculum and how you can apply it at your school by viewing the one-page Executive Summary and the full Final Report on the Project Overview page.

A NITC education grant funded a new course for planners, engineers, scientists and students to help improve their data processing workflow.

Liming Wang, an assistant professor in the Toulan School of Urban Studies & Planning at Portland State University, is on a mission to simplify data processing. A NITC education grant supported his efforts to develop a new course: Introduction to Data Science (Aug 6 - 10, 2018). The course is designed to help students and professionals to improve their workflow for data-intensive research. The course covers how to collect data, clean them up, visualize, explore, model and eventually compile the data with findings in a report.

"I've pretty...

Read more

Pages