
Friday Transportation Seminars at Portland State University have been a tradition since 2000. You can join us online at 11:30 AM.
PRESENTATION ARCHIVE
THE TOPIC
Past research and planning has highlighted the existence of pedestrian injury disparities throughout the US and some local agencies have performed cursory analysis in Oregon. However, no statewide analysis of pedestrian injuries in Oregon has been completed to see how these injury outcomes differ by race and income.
This presentation aims to help better understand the factors...
Read more
The video begins at 0:34.
View slides
Speaker: Joseph Broach, Ph.D. Candidate, Portland State University
Topic: Trick or Treatment? Impact of Route-Level Features on Decisions to Walk or Bike
Summary: Some travel routes attract people walking and cycling, while others may scare them away. What features of street environments are most important, and how do available routes affect decisions to bike or walk on a specific trip?
Research to date has focused on either large-scale areal measures like "miles of bike lane nearby" or else has considered only shortest path routes. Neither method is suited to capturing the impact of targeted route-level policies like neighborhood greenways. This session will present a new technique for measuring bike and walk accessibility along the most likely route for a given trip. The method is applied to travel data, and results provide new insight into the relationship between route quality and travel mode choice.
The video begins at 2:12.
Abstract: A new way of measuring Level of Service for bicycles, pedestrians, and transit is planned for the next Highway Capacity Manual. Are these the right tools to help us plan and build the system we want? If not, what answers do these tools give us and how should we use them? This presentation will review the approaches to multi-modal Level of Service at the national and local levels and discuss efforts to validate the HCM methods. It will also cover the effect of our LOS policies on climate change and explore ways that we might tweak our analysis to get a more accurate picture of the transportation system for all users.
Bio: Seleta Reynolds plans, funds, and implements bicycle and pedestrian projects as a consultant for the Seattle office of Fehr & Peers. Seleta contributed to the national Safe Routes to School toolbox and has served as a guest lecturer on transportation planning for San Jose State University, Portland State University, and UC Berkeley. She serves on the Transportation Research Board Pedestrian Committee and as the President of the Association of Pedestrian and Bicycle Professionals. One of her favorite side projects was a collaboration with artists Steve Lambert and Packard Jennings to imagine the future of transportation for the Art on Market Street project in San Francisco. Prior to joining Fehr & Peers in 2001, she was the bicycle and...
Read moreView slides
If you would like to receive continuing education credits such as PDH or CM, please make sure to complete this evaluation form once you've watched the entire video so that we have a record of your attendance.
Watch video:
Read more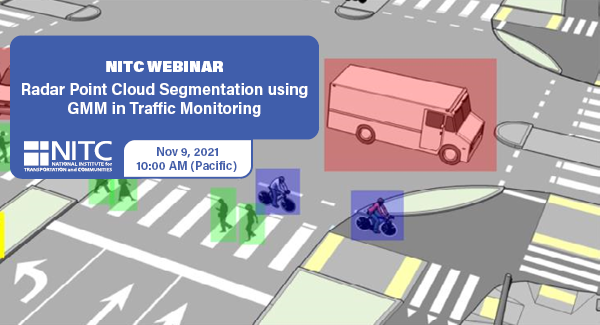
PRESENTATION ARCHIVE
OVERVIEW
Intelligent transportation systems (ITS) change our communities by improving the safety and convenience of people’s daily mobility. The system relies on multimodal traffic monitoring, that needs to provide reliable, efficient and detailed traffic information for traffic safety and planning. How to reliably and intelligently monitor intersection traffic with multimodal information is one of the most critical topics in intelligent transportation research.
In multimodal traffic monitoring, we gather traffic statistics for distinct transportation modes, such as pedestrians, cars and bicycles, in order to analyze and improve people’s daily mobility in terms of safety and convenience.
In this study, we use a high-resolution millimeter-wave (mmWave) radar sensor to obtain a relatively richer radar point cloud representation for a traffic monitoring scenario. Based on a new...
Read more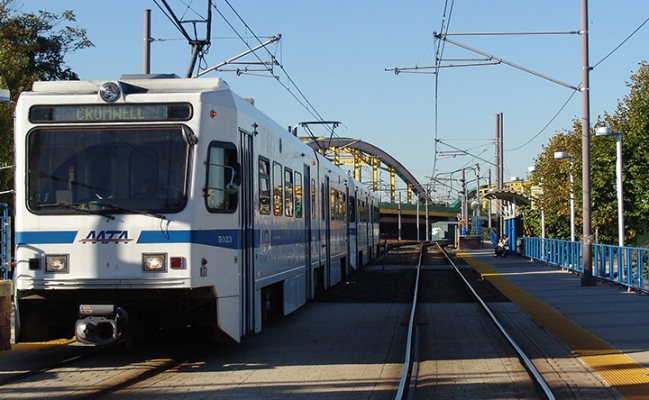
The video begins at 0:29.
View slides
Speaker: Brian Saelens, Professor of Pediatrics and Psychiatry & Behavioral Sciences, Seattle’s Children’s Hospital & University of Washington
Topic: Links Between Public Transportation and Physical Activity (Effects of LRT on Physical Activity Based on Seattle GPS Study)
Summary: This seminar will explore the empirical evidence regarding the links between the use of public transportation and physical activity, with a specific focus on using integrated device and self-report methods to identify travel modes and physical activity.
Bio: Brian E. Saelens, Ph.D. is a Professor of Pediatrics and Psychiatry & Behavioral Sciences at the University of Washington and Principal Investigator at Seattle Children’s Research Institute. Dr. Saelens is a clinical/health psychologist. His interest areas include obesity treatment and prevention, especially in environmental factors and policies that influence physical activity and eating behaviors in children and adults. He has published over 150 peer-reviewed original investigation and review articles.
Watch video
View slides
View Q&A: This document contains questions that were submitted during the webinar and the answers to them, which were not included in the broadcast due to time constaints.
Learn from experts and share your knowledge of how to count pedestrians. Are people with clipboards the only way? What technologies work and how can we use them? How can an agency improve an existing or start a new pedestrian count program? Join us for an information sharing webinar on this quickly evolving topic. We will learn from leaders in the field and encourage active audience involvement, so come prepared to share your experience!
This IBPI webinar is part of a project sponsored by FHWA to study best practices in pedestrian traffic monitoring.
Portland State University is working with ICF International and Sprinkle Consulting on a contract to the U.S. Department of Transportation, Federal Highway Administration to advise them on potential improvements to the Traffic Monitoring Guide specific to pedestrian travel.
Featuring:
- David Jones of the Federal Highway Administration will introduce the topic and...