Authored by Mike McQueen and John MacArthur, Portland State University

Electric bikes (e-bikes) are quickly becoming common in U.S. cities and suburbs, but we still have a ways to go compared to our neighbors across the Atlantic.  In recent years, e-bike sales have steadily increased with unprecedented growth in Europe, especially in the Netherlands. Can the U.S. catch up? E-bikes offer a cheaper alternative to car travel and also provide physical activity. Riders with limited physical ability find that e-bikes extend their overall mobility. Beyond the practical, e-bikes are also just fun to ride. In fact, e-bikes encourage users to cycle farther and more often than conventional bicycles. More importantly to local and regional U.S. governments, e-bikes could be a useful tool to address our current climate crisis by reducing transportation greenhouse gas (GHG) emissions.

Related research: MacArthur and McQueen are also working with the National Science Foundation to collect e-bike user data via onboard technology. To learn more or participate in that study, visit the Mobility By E-Bike Project.

E-bike incentive programs in the U.S. remain relatively small in scale. Currently, California and Oregon offer statewide incentive programs that provide rebates towards the purchase of battery electric vehicles (BEV), plug-in hybrid electric vehicles (PHEV), and fuel cell electric vehicles (FCEV). These programs are intended to reduce state GHG emissions from the transportation system. Could incentivizing e-bikes also be a cost-effective way for regions to reach their greenhouse gas emission reduction goals?

Today the Transportation Research and Education Center (TREC) at Portland State University launches a new Electric Vehicle Incentive Cost and Impact Tool. This online tool enables policymakers, public stakeholders, and advocates to quickly visualize the potential outcomes of an electric vehicle incentive program made up of several vehicle types. The tool estimates the cost efficiency of a proposed program in terms of the cost per kg CO2 avoided by each mode over the course of one year. It also takes the proposed budget into consideration to calculate the potential number of incentives to be made available and the amount of total CO2 that would be avoided due to internal combustion engine automobile (ICE) VMT displacement.

To show you how it works, we tried out the tool with Oregon as a case study. Currently, the state sets aside about $12M per year for its Oregon Clean Vehicle Rebate Program, with rebates usually offered at $2,500 each for BEV and PHEV vehicles with battery capacity of 10 kWh or more and $1,500 for vehicles with batteries with less than 10 kWh. How do BEVs, PHEVs, and e-bikes compare in terms of incentive program cost efficiency and greenhouse gas emissions avoided?

USING THE EV INCENTIVE COST AND IMPACT TOOL: AN OREGON CASE STUDY

Creating your EV Incentive Program

First, let’s get the tool set up with information for the state of Oregon. We’ve designed the tool with all of the data you need, and you simply choose the presets for your scenario. It’s also easy to use your own data by just entering it directly into the tool. Apply presets with information for the electricity generation emissions profile from the US EPA eGRID, average car travel information from the NHTS, and national ICE fuel efficiency information from the US Bureau of Transportation Statistics.

 [[{"fid":"4916","view_mode":"default","fields":{"format":"default"},"type":"media","field_deltas":{"19":{"format":"default"}},"attributes":{"class":"media-element file-default","data-delta":"19"}}]]

Next, apply some information about the vehicles you’re looking to incentivize. Again, we’ll just use presets that we’ve created: 

  • The E-Bike preset is an average of the fuel economies of several e-bike models studied in a recent paper by Efficiency Vermont. It may be unreasonable to expect most people to completely replace all of their automobile VMT with an e-bike. To account for this, we specify that the average user will only replace 15% of their VMT with their incentivized e-bike. 

  • The BEV preset is a weighted average of fuel economies provided by the US EPA of the current BEV fleet in Oregon. 

  • Similarly, the PHEV preset is a weighted average of fuel economies provided by the US EPA of the current PHEV fleet in Oregon. Fleet information was obtained from the Oregon Department of Transportation (ODOT) based on historical rebate distribution within the state.

[[{"fid":"4917","view_mode":"default","fields":{"format":"default"},"type":"media","field_deltas":{"20":{"format":"default"}},"attributes":{"class":"media-element file-default","data-delta":"20"}}]]

Lastly, we can set our incentive amounts and total budget. We can also choose how to distribute our budget among the vehicles we’re incentivizing. Let’s set the BEV and PHEV incentive to $2,500 and the total budget to $12M, similar to Oregon’s current program. We’ll try out an e-bike incentive of $350, and for this example we’ll split the budget evenly among each vehicle type.

[[{"fid":"4901","view_mode":"default","fields":{"format":"default"},"type":"media","field_deltas":{"4":{"format":"default"}},"attributes":{"class":"media-element file-default","data-delta":"4"}}]]


Once you’re all done creating your incentive program scenario, you can export a report for quick reference when discussing options with other stakeholders.

Review the Results: What did we find in Oregon?

First off, we get some information about incentive cost efficiency. It turns out that the e-bike incentive is more cost efficient, in terms of cost per kg CO2 saved, than both the BEV and PHEV incentives.

[[{"fid":"4902","view_mode":"default","fields":{"format":"default"},"type":"media","field_deltas":{"5":{"format":"default"}},"attributes":{"width":"600","class":"media-element file-default","data-delta":"5"}}]]

[[{"fid":"4904","view_mode":"default","fields":{"format":"default"},"type":"media","field_deltas":{"7":{"format":"default"}},"attributes":{"class":"media-element file-default","data-delta":"7"}}]]

Next, we can look at the total number of incentives our program is able to provide. Because the e-bike incentive is much lower in price, the program is able to impact almost 10 times as many people’s lives with a new e-vehicle compared to the BEV or PHEV incentives given our $12M budget.

[[{"fid":"4903","view_mode":"default","fields":{"format":"default"},"type":"media","field_deltas":{"6":{"format":"default"}},"attributes":{"width":"600","class":"media-element file-default","data-delta":"6"}}]]

[[{"fid":"4905","view_mode":"default","fields":{"format":"default"},"type":"media","field_deltas":{"8":{"format":"default"}},"attributes":{"class":"media-element file-default","data-delta":"8"}}]]

Lastly, let’s look at the GHG impacts of our program over the course of 1 year. The program is able to reduce the amount of CO2 emissions of one year by about 25M kg thanks to the incentive program we designed. Given how we’ve structured this incentive program, e-bikes make up the largest portion of this CO2 savings, about 40% of the entire impact.

[[{"fid":"4906","view_mode":"default","fields":{"format":"default"},"type":"media","field_deltas":{"9":{"format":"default"}},"attributes":{"width":"600","class":"media-element file-default","data-delta":"9"}}]]

[[{"fid":"4907","view_mode":"default","fields":{"format":"default"},"type":"media","field_deltas":{"10":{"format":"default"}},"attributes":{"width":"600","class":"media-element file-default","data-delta":"10"}}]]

“What-if” Scenarios for E-bike Incentive Amounts

Let’s do a quick set of “what-if” scenarios to see how changing the e-bike incentive from $350 impacts the results.

What if the e-bike incentive was $150?

What we found for a $150 e-bike incentive (versus $350):

  • The cost per kg of CO2 saved has decreased, from $0.40 to $0.17.
  • The number of e-bike incentives we can offer has more than doubled, from 11,314 to 26,400.
  • Similarly, the amount of CO2 avoided due to e-bikes has also more than doubled, from 10.2M kg to 23.9M kg. This accounts for 61% of the total CO2 savings in this case.

What if the e-bike incentive was $500?

What we found for a $500 e-bike incentive (versus $350):

  • The cost per kg CO2 saved has gone up from our initial case study, from $0.40 to $0.55 per kg CO2 saved. However, this is on par with the cost efficiency of the PHEV incentive.
  • The number of e-bike incentives that can be offered has decreased, from 11,314 to 7,920. However, we’re still able to offer more incentives than the BEV and PHEV incentives combined.
  • Lastly, the total CO2 saved has also declined, from 10.2M kg to 7.2M kg, although it is still on par with the BEV and PHEV categories.

Final Thoughts

This case study has shown that e-bikes could be a strong player as part of a CO2 avoidance e-vehicle incentive program. In some cases, e-bikes could perform better than electric vehicles in terms of cost efficiency, number of incentives provided, and total CO2 saved.

The Electric Vehicle Incentive Cost and Impact Tool is available online, and is able to generate a downloadable report for sharing purposes.

Contact John MacArthur (macarthur[at]pdx.edu) with any questions or comments about the tool, and let us know how you used it!

ABOUT THE AUTHORS

John MacArthur

Sustainable Transportation Program Manager

John MacArthur is the Principal Investigator for TREC's electric bicycle research initiatives. His research also includes low-/no-emission vehicle infrastructure in Portland metro, as well as a climate change impact assessment for surface transportation in the Pacific Northwest and Alaska. Before joining the TREC staff, John was the Context Sensitive and Sustainable Solutions Program Manager for the Oregon Department of Transportation’s OTIA III State Bridge Delivery Program.

Mike McQueen

Graduate Research Assistant

Mike McQueen is a second year master's student working with John MacArthur of TREC and Dr. Kelly Clifton of the MCECS Department of Civil and Environmental Engineering. Currently, Mike is researching e-bike travel behavior and micromobility as an Eisenhower Fellow. In the past, he has studied e-bike purchase incentive programs, the potential positive environmental impact of e-bikes in Portland, BIKETOWN, and the demographics of zero car households.

The Transportation Research and Education Center (TREC) at Portland State University is home to the National Institute for Transportation and Communities (NITC), the Initiative for Bicycle and Pedestrian Innovation (IBPI), and other transportation programs. TREC produces research and tools for transportation decision makers, develops K-12 curriculum to expand the diversity and capacity of the workforce, and engages students and professionals through education.

Researchers
macarthur@pdx.edu

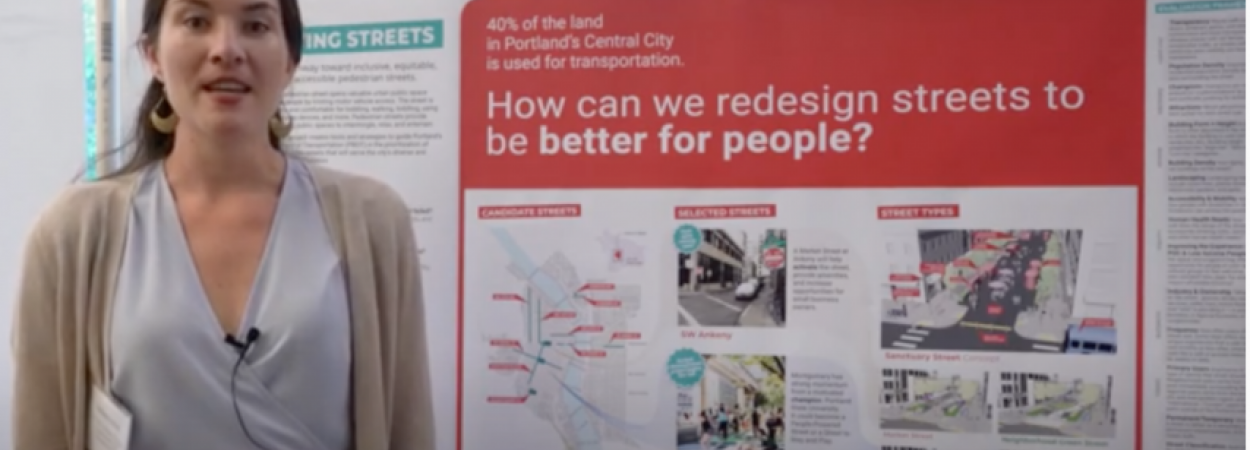
Kate Wihtol is a 2019 graduate of the Master of Urban and Regional Planning (MURP) program at PSU. As of 2020 she is an associate planner at the Oregon Department of Transportation. Kate worked with fellow MURP students of the Living Streets project team to develop a pathway toward inclusive, equitable, and accessible pedestrian streets for the Portland Bureau of Transportation. In this video she talks about their work to identify best practices and recommendations tailored to Portland’s urban context: a city built for cars, but aspiring and progressing toward a more walkable, bikeable, and transit-friendly future.

Watch the interview with Kate.

Photo by cybrain, iStock

NSF SCC RAPID: Consumer Responses to Household Provisioning During COVID-19 Crisis and Recovery

Kelly Clifton, Portland State University; Rebecca Lewis, University of Oregon


This article was authored by Katy Swordfisk and cross-posted from Portland State University.

The COVID-19 pandemic has changed people’s relationships with the outside world. Researchers from Portland State University and the University of Oregon have received a grant from the National Science Foundation to study how shopping strategies have changed as consumers quickly become more reliant on e-commerce to access basic resources. The $168,914 grant comes from the NSF’s RAPID program, designed to study phenomena that require more immediate understanding.

“People have changed their relationship with their local stores and how they engage and shop,” said Kelly Clifton, principal investigator and PSU professor of Civil and Environmental Engineering. “To the extent they can, people have started to explore online options.”

But access to online shopping necessitated by the pandemic is inequitable. Many vulnerable communities are more transit-dependent or have limited access to online technology.

To better understand these different relationships, the collaborative study will reach across disciplines. 

“While the smart cities and new mobility space is rich with projects that focus on personal transportation and mobility, research in the e-commerce and delivery landscape is more limited. Our study will provide rich data on perceptions and use of technology to meet basic needs during the COVID-19 pandemic,” said Rebecca Lewis, co-PI and associate professor of Planning, Public Policy and Management at the University of Oregon. 

“We will rely on our collective expertise in travel behavior, land use, and e-commerce to examine what contributes to use of technology to meet basic needs. We hope that our project will provide tangible recommendations for policy-makers about barriers and opportunities for relying on technology for household provisioning,” Lewis said.

Clifton said they are especially interested in resilience planning.

“Should we have another pandemic or earthquake or situation that impacts us, how can we think of food provision in a more robust way?” Clifton said. “How can we make sure everyone gets what they need?”

The survey will be conducted in Washington, Michigan and Florida over the next year. The first survey of 1,000 households will be conducted in June with two more surveys spread out over the next eight to 12 months. 

Clifton said the survey will emphasize reaching out to those populations that may not have a record of purchasing online, but they are also interested in hard to reach populations including the elderly, low-income or non-English speaking households.

“The ongoing COVID-19 pandemic appears to be accelerating trends that were already underway prior to the outbreak, such as the increasing adoption of e-commerce for household provisioning,” said Amanda Howell, project manager at UO's Urbanism Next center. “This NSF RAPID grant will enable us to collect critical data about the rate of technological adoption and general trends in household provisioning, as well as the barriers to access that many people face in order to identify potential interventions.”

The Transportation Research and Education Center (TREC) at Portland State University is home to the National Institute for Transportation and Communities (NITC), the Initiative for Bicycle and Pedestrian Innovation (IBPI), and other transportation programs. TREC produces research and tools for transportation decision makers, develops K-12 curriculum to expand the diversity and capacity of the workforce, and engages students and professionals through education.
Authored by Tammy Lee, Transportation Data Manager, Portland State University

Traditionally, the month of May is Bike to Work Month. Last year this time, Oregon logged 179,177 trips for a total of 1,374,835 miles by 10,397 riders. And last year this time TREC was winning the PSU bike to work month department challenge. So what are we seeing in the data now?

For continuity from the last time we posted some bike volume observations, we’re again showing data from the Hawthorne Bridge and Tilikum Crossing (Figure 1) in Portland, Oregon. At the moment, daily volume across the Hawthorne Bridge remains relatively low. Typically we’d expect bike volumes across the Hawthorne would be higher in May, especially because if this were “normal” times we’d be competing in the Bike to Work Month challenge. Bike volumes across the Tilikum show higher volumes beginning in April, especially on the weekends since the March 23, stay-at-home order was issued.

Image removed.

Figure 1. Daily bike volumes across Hawthorne Bridge and Tilikum Crossing. EB = eastbound; WB = westbound. The solid orange line (March 12) represents the closing of schools; the dotted orange line (March 23) represents the “stay-at-home” announcement.

Perhaps the difference in bike volume trends between the two bridges can be attributed to the type of facility and location. Hawthorne Bridge is a main thoroughfare into downtown Portland, and the Tilikum is located by OHSU and excludes vehicular access. Personally, it’s more pleasant to ride across the Tilikum, but it’s out of the way for me if I’m biking to work. If most people probably aren’t biking to work, are they biking for fitness?

Based on a brief analysis by PSU’s Dr. Jay Gopalakrishnan, one way to look at the data is to compare weekday versus weekend bike volumes. Using data from the Tilikum, we took the average 15-minute volume Monday through Friday for weekdays, and Saturday and Sunday for weekends, and compared it to pre- and post-stay-at-home. For pre-stay-at-home, we had a few years worth of data to calculate the average 15-minute bicycle volume (days with no data were excluded).

Figure 2 below shows pre-stay-at-home on the top panels, and post-stay-at-home on the bottom panels with the left panels representing average 15-minute weekday volume, and the right panels representing the average 15-minute weekend volume. What we saw:

  • Pre-stay-at-home weekday there is a distinct bimodal distribution of the westbound morning commute and the eastbound evening commute.
  • Pre-stay-at-home weekend there is a single afternoon bump.
  • Post-stay-at-home weekday average volumes look more like the weekend.
  • Post-stay at home weekends are showing higher average volumes than before.

Image removed.

Figure 2. Average 15-minute bicycle volumes across Tilikum Crossing pre- (before March 23) and post-stay-at-home (March 23 through May 18).

Data from Tilikum suggests that people are shifting from biking for commuting to biking for recreation and fitness. How does this compare to other places? Seattle is showing similar trends across the Folsom Bridge, and a recent survey from Cascade Bicycle Club indicated that a majority of their respondents are biking at the same rate if not more since COVID-19 crisis began.

We have also noticed a similar trend in other parts of the country. Below we have included a comparison of weekday versus weekend average 15 minute bike volume for pre- and post-stay-at-home announcements for locations in Arlington, Virginia (Figure 3); and Boulder, Colorado (Figure 4). Both locations are in areas used by commuters. And in both locations there is the bimodal morning/evening peak weekday commute pre-stay-at-home that shifts to unimodal weekend pattern. 

Image removed.

Figure 3. Key Bridge, Arlington, VA. Pre-stay-at-home before March 23; post-stay-at-home includes March 23 through May 18.

The Key Bridge (VA), linking Arlington to DC, shows more than double the weekend bike volume post-stay-at-home; however, the Folsom St (CO) location does not show an increase in average bike volume which may be because the detector is located near an entrance to the University of Colorado, Boulder, where in-person classes were cancelled on March 11, 2020.

Image removed.

Figure 4. Location of Folsom St. south of Arapahoe Ave, Boulder, CO. Pre-stay-at home before March 19; post-stay-at-home includes March 19 through May 18.

To reiterate from our previous post, it’s a waiting game for more time-based data in order to get a clearer picture of how COVID-19 related social and economic policies affect bicycle travel in the U.S.

ABOUT THE AUTHOR

Tammy Lee, Ph.D.
Transportation Data Program Administrator

Tammy is working on a variety of projects for TREC, including documentation, data synthesis, analysis, and visualization supporting ongoing work with PORTAL and Bike-Ped Portal. Prior to joining TREC, she worked as a data scientist for a political digital media consulting firm.

The Transportation Research and Education Center (TREC) at Portland State University is home to the National Institute for Transportation and Communities (NITC), the Initiative for Bicycle and Pedestrian Innovation (IBPI), and other transportation programs. TREC produces research and tools for transportation decision makers, develops K-12 curriculum to expand the diversity and capacity of the workforce, and engages students and professionals through education. For resources and tools for remote teaching during the quarantine period, check out our TREC and COVID-19 resource page.

Photo by Nathan McNeil

Revisiting TODs: How Subsequent Development Affects the Travel Behavior of Residents in Existing Transit-Oriented Developments

Nathan McNeil and Jennifer Dill, Portland State University

Does living in a transit-oriented development (TOD) actually change the way people travel? That's the fundamental question that 15 years of research in Portland, Oregon seeks to answer.

Since 2005, Portland State University has worked with Portland’s Metro regional government to survey occupants of buildings for which developers had received funding from Metro’s Transit-Oriented Development (TOD) Program. Metro strategically invests in TODs to help more people live, work and shop in neighborhoods served by high-quality transit. "Revisiting TODs," the latest installment in this research, is led by Nathan McNeil, a research associate in PSU's School of Urban Studies & Planning, and TREC director Jennifer Dill.

The report, released this month, revisits a set of suburban TODs with a second wave of surveys to understand how the travel behavior of TOD residents may have changed since the first survey. As neighborhoods become more developed with walkable amenities, how can we identify which factors influence changes in travel patterns?

BACKGROUND: 15 YEARS OF SURVEYS

Given the longstanding partnership between PSU and Metro, this research series was perfectly poised to investigate changes over time. Jennifer Dill, the director of PSU's Transportation Research and Education Center (TREC), led the first project in 2005. How do TOD residents commute? How often do they walk, bike and use transit compared with driving? Since then, the study has been periodically revisited:

  1. 2006 Estimating the Impacts of TODs on Travel and Transit Use
  2. 2007 Travel Choices at TransitOriented Developments: Survey Results from Portland’s Eastside
  3. 2010 Transit Oriented Developments Survey
  4. 2014 Transit Oriented Developments Survey
  5. 2020 Revisiting TODs: How Subsequent Development Affects Travel Behavior

WHAT'S NEW IN 2020?

The second-wave surveys, coming 8-13 years after the baseline surveys, include five TODs in the west-side Portland suburbs of Hillsboro and Beaverton, two TODs in East Portland, and eight TODs in the east-side Portland suburb of Gresham. Second-wave surveys were sent to the same buildings as the baseline surveys (in most cases, to every unit), but not specifically to the same people as in the baseline. Surveys asked about household travel options, daily travel for work and non-work purposes, and questions on travel preferences and attitudes.

"Some of these buildings were the first residential mixed-use buildings to go up near a transit station. So we wanted to find out, as those blocks nearby get filled in, does that have any impact on travel behavior? We selected buildings where we saw that there had been neighborhood change over time. Our hypothesis was that we wouldn't expect transit use to change all that much, but we might expect more walking and biking with a more built-out neighborhood in the immediate vicinity, and maybe more shops or restaurants nearby," McNeil said.

KEY FINDINGS 

The second wave of surveys revealed three changes from the baseline that are consistent with the objectives of TODs:

  1. The share of people commuting to work by driving alone four to five days a week fell from 58% to 46%, while the share never driving alone rose from 11% to 24%.
  2. The share of people walking or biking to work at least one day a week rose from 9% to 29%; and
  3. The share of people living in low-car households (fewer cars than adults) increased from 34% to 50%.

The residents’ attitudes about travel were very consistent between the two surveys. The only significant changes were:

  1.  an increased preference for walking rather than driving whenever possible;
  2. a decrease in feeling that getting to work without a car is a hassle; and
  3. a decrease in whether gas prices affected daily travel choices. 

Consistent with those changes, a higher share of respondents in the second-wave surveys indicated that having sidewalks in the neighborhood was extremely important in choosing their current home (43% in 2020 vs. 31% in earlier surveys) and a lower share said that easy access to the freeway was extremely important (16% vs. 22%). The importance of transit access remained steady at 48%.

Image removed.

The research team is working on further analysis, including multivariate analysis, to identify specific factors that may help explain the travel behavior changes we did observe, including factors related to neighborhood change.

IMPLICATIONS

Transit-oriented development (TOD) seeks to create a symbiotic relationship between two significant infrastructure investments: public transportation and residential and/or commercial buildings. How can policymakers maximize the potential of both? Dense mixed-use buildings provide potential transit riders, while proximity to quality transit provides building residents, employees and visitors with improved access to jobs, services and recreation. However, other factors in the urban environment around the station and TOD building affect the likely success of both. This research offers insights that can help planners understand the factors influencing travel behavior at TODs, including neighborhood features.

"The webinar that we'll do next month will include both findings from this report and also a retrospective of all the TODs surveyed over the years. So that presentation will offer a more broad overview of our TOD research, including more buildings than we were able to include in this report," McNeil said.

LEARN MORE: Register for the June 2 webinar

This research was funded by the National Institute for Transportation and Communities, with additional support from Metro and Portland State University.

RELATED RESEARCH

To learn more about this and other TREC research, sign up for our monthly research newsletter.

The Transportation Research and Education Center (TREC) at Portland State University is home to the National Institute for Transportation and Communities (NITC), the Initiative for Bicycle and Pedestrian Innovation (IBPI), and other transportation programs. TREC produces research and tools for transportation decision makers, develops K-12 curriculum to expand the diversity and capacity of the workforce, and engages students and professionals through education.

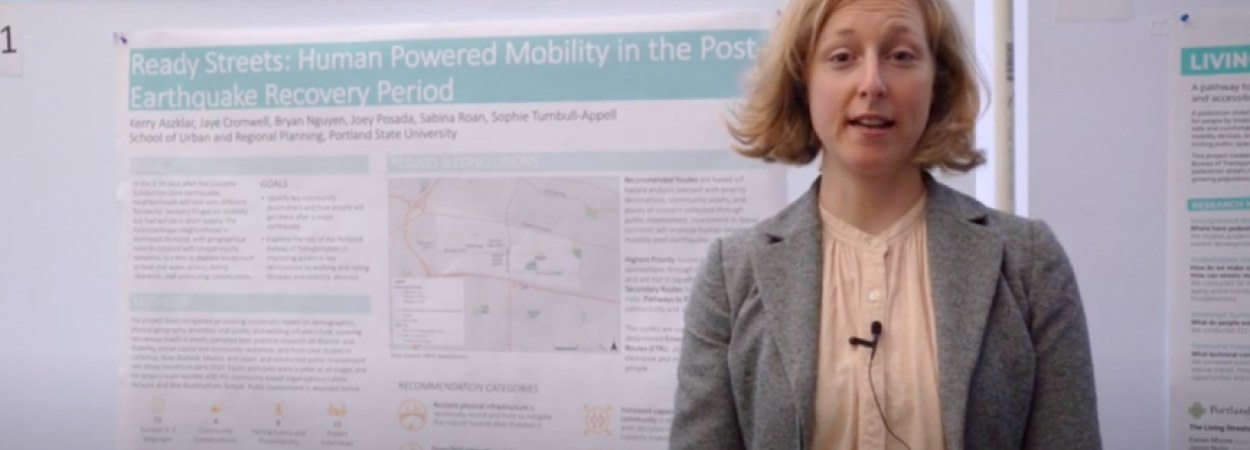
In the 2-30 days after a major earthquake, neighborhoods might look very different. Walking and rolling are more dependable ways for people to get around because they do not require fuel. This project examined how a resilient neighborhood-level transportation network could help neighborhoods recover after a major disaster. Hear more in this interview with Sabina Roan, a Master of Urban and Regional Planning graduate of PSU.

Watch the interview with Sabina.

Each year, through our Initiative for Bicycle and Pedestrian Innovation (IBPI) program, TREC offers a range of scholarships to assist students pursuing equitable, sustainable, and multimodal transportation. Four Portland State University students were awarded TREC scholarships for the 2020/2021 academic year: Darshan Chauhan of civil & environmental engineering, and Robert Hemphill, Philip Longenecker and Briana Orr of urban studies & planning.

Darshan Chauhan (Walter H. Kramer Fellowship)

Darshan Chauhan (see his NITC student spotlight here) is a graduate research assistant in civil engineering at Portland State University. He has served as the treasurer of STEP (Students in Transportation Engineering and Planning), PSU's transportation student group, and generously volunteers his time at a variety of transportation-related events via PSU's Transportation Research and Education Center (TREC). He defended his masters thesis on network flow problems in fall 2019, and is now a PhD student in the civil engineering program. In the 2018/2019 and the 2019/2020 academic years, Darshan also earned a Walter H. Kramer Fellowship from Portland State University.

"The best thing about transportation is that it is about people and is community-centric. Along with this human aspect, also comes a lot of uncertainty. The work I do with Dr. Unnikrishnan is about appreciating this uncertainty and using it to make more comprehensive decisions for various facets of transportation.  Motivated by Dr. Walter H. Kramer's vision, this fellowship furthers my passion for making a difference in 'our cities, our society, and the community' through transportation." —Darshan Chauhan

Robert Hemphill (IBPI Active Transportation Scholarship)

Rob Hemphill is a student in the Master of Urban and Regional Planning, interested in the intersection of transportation, housing, and land use to create complete and equitable neighborhoods. His academic work includes researching anti-displacement strategies for businesses impacted by the SW Corridor Light Rail, assessing the sustainable transportation policy options in the City of Portland and Multnomah County Climate Action Plan, and addressing e-scooter parking compliance issues with NITC scholar Phil Longenecker. Prior to attending PSU, Rob worked in the energy efficiency sector, the nonprofit sector, and political campaigns. Outside of school, Rob has been an activist with No More Freeways and Portland For Everyone. He has volunteered for Oregon Walks and The Street Trust. He lives car free and sometimes tries to see how many mobility options he can use in a day, often on the way to and from Portland Thorns games.

"TREC's commitment to making our transportation systems equitable for all users is evident in its IPBI Active Transportation scholarship and partnership with Alta Planning + Design. Together, these programs support research and tangible experience for people like myself that want mobility options and opportunity available to everyone. As we enter a new era grappling with the need for a built environment that provides physical space for everyone, the same foundations of active transportation will guide us. Further, through all the pandemic shenanigans, Portland State has continued to use the city and community as a laboratory for teaching, as we link the built environment to current outcomes from the pandemic and a future community more resilient. Knowledge continues to serve the city, and I am grateful for the opportunity to be a part of that and gain experience that will carry on to my future career." —Robert Hemphill

Philip Longenecker (Excellence in Active Transportation Scholarship)

Philip Longenecker is a transportation planner at Alta Planning + Design, working on a range of projects including bicycle, pedestrian and trail master plans; new mobility strategies, statewide active transportation plans, encouragement and education programs, and bike share projects. He is a current masters student studying urban and regional planning at Portland State University. He has also been a bicycle and pedestrian planning intern for Hennepin County in Minnesota, as well as worked for the City of Minneapolis prior to moving to the Pacific Northwest.


"I am extremely thankful for the Excellence in Active Transportation award, it has given me the peace of mind to focus more on continuing my studies in bicycle and pedestrian planning and less on how to pay for school. The Transportation Research and Education Center at PSU is the reason why I moved to Oregon and pursue my planning degree here as opposed to other institutions, and I'm so thankful for the research opportunities it has afforded me. The knowledge, resources, and influence of TREC in shaping urban transportation policy makes it an invaluable component of Portland State University and its been an honor to take part in it." —Philip Longenecker

Briana Orr (Excellence in Active Transportation Scholarship)

Briana Orr is a Capital Projects Planner at the Portland Bureau of Transportation (PBOT), advancing the delivery of Central City in Motion, PBOT's effort to implement pedestrian crossings, bus lanes, and bikeways in the city’s core. She has also served as PBOT's E-Scooter Pilot Project Manager and Bike Share Coordinator (check out her February 2019 presentation on the Portland E-Scooter Experience). She is a current masters student at Portland State University studying urban and regional planning. Briana’s work centers on making active transportation convenient, fun, and normal. Prior to PBOT, Briana worked in Seattle as Cascade Bicycle Club’s Communication Manager, and secured seed funding for bike share in Eugene as the University of Oregon’s first professional Bike Coordinator. Since her undergraduate days at the University of Oregon, Briana has been recognized for her leadership, engagement and initiative, and last year she won a WTS Portland scholarship as well as a 2019-2020 Excellence in Active Transportation Scholarship.

"Nine years after getting my diploma, I’m still paying off student loans for my undergraduate degree. This debt has prevented or delayed my ability to invest in areas in my life, including delaying my ability to pursue a master's degree. With the goal of obtaining a master's without falling deeper into debt, the availability of scholarships at PSU was critical to my decision to return to school. I feel incredibly fortunate for support from the Transportation Research and Education Center. Thanks in part to scholarships such as the Excellence in Active Transporation, I’ve been able to manage the cost of tuition without taking out additional loans. This means I can focus on advancing my knowledge and career instead of having to focus on how I'll pay for it. In short, the Excellence in Active Transportation scholarship is helping me today, and it is also helping me create a more financially secure future for myself tomorrow." —Briana Orr

The Transportation Research and Education Center (TREC) at Portland State University is home to the National Institute for Transportation and Communities (NITC), the Initiative for Bicycle and Pedestrian Innovation (IBPI), and other transportation programs. TREC produces research and tools for transportation decision makers, develops K-12 curriculum to expand the diversity and capacity of the workforce, and engages students and young professionals through education.

Photo by Cait McCusker

NSF Collaborative Research: RAPID: Maintain Mobility and Reduce Infection Through a Resilient Transit and Micromobility System

Chris Cherry and Candace Brakewood, University of Tennessee, Knoxville

John MacArthur, Portland State University


The rapid spread of COVID-19 has changed the way most of the world moves through daily life, with many businesses having to temporarily close and students of all levels forced to transition to online courses.

Even so, grocery stores, medical facilities, and takeout restaurants remain open, requiring workers to commute to and from work. In metro areas, that can often mean taking some form of transit, potentially exposing workers in these vital areas to the disease. 

In a collaborative project between University of Tennessee at Knoxville and Portland State University, researchers Chris Cherry (UT), Candace Brakewood (UT) and John MacArthur (PSU) are studying the impacts of people’s travel decisions on transit, shared bikes and e-scooters, and it comes with backing from a National Science Foundation RAPID Award

These awards are granted for research with "a severe urgency with regard to availability of, or access to data, facilities, or specialized equipment, including quick-response research on natural or anthropogenic disasters and similar unanticipated events." Events like our current pandemic.

Moving forward, the research team is partnering with local public agencies WeGo Public Transit, TriMet, and the City of Portland’s Bureau of Transportation to look at commuting patterns in Nashville, Tennessee and Portland, Oregon. Bike share and e-scooter share companies Bird, Spin, and BIKETOWN as well as Transit app will also be providing support to track changes in ridership during recovery.

“Working closely with local and national partners will give us, and policymakers, a clearer picture of where transportation priorities and opportunities lie,” MacArthur said. “We’re hoping our models can help predict how city transit systems will recover for current and future public health crises.”

The main question they wanted to answer was whether widespread adoption of new modes of transportation, such as bike share and e-scooters, would offer workers a way to get to work without putting them in the close confines of other passengers on traditional transit, and whether people would even choose these modes in the first place.

“Transportation demand has dropped by 50-to-90 percent across all modes in the US, and transit has been particularly hard hit with micromobility modes like shared bikes and electric scooters also seeing large drops in use,” Cherry said. “As travel demand recovers, it is important to understand the role of all shared modes in restarting the economy and maintaining social distancing.”

One of the early findings is that answers to those questions vary greatly by city or region. In New York and Chicago, for example, bike share usage was up 65 percent from the same date the year before, but in Seattle and San Francisco, bike share use has plummeted. 

The answer as to why there is such a variance may lie with the cities themselves. 

“It, not surprisingly, is tied to the kind of response the city had to the virus,” Brakewood said. “In Seattle and San Francisco, there was a greater shutdown of activity and at a sooner date than in Chicago and New York. Where businesses stayed open longer, workers were required to report longer, but the good thing is that it shows that those workers at least tried to find methods of commuting that still allowed them to be better spaced from others.” 

Beyond Nashville and Portland, the team will also look at ridership trends across various modes of transportation, giving them a more robust understanding of how other U.S. cities and the workers within them respond to times of crisis, helping guide future decisions.

The Transportation Research and Education Center (TREC) at Portland State University is home to the National Institute for Transportation and Communities (NITC), the Initiative for Bicycle and Pedestrian Innovation (IBPI), and other transportation programs. TREC produces research and tools for transportation decision makers, develops K-12 curriculum to expand the diversity and capacity of the workforce, and engages students and professionals through education.

In 2018, Vision Zero was adopted as part of Portland’s Regional Transportation Plan for the first time. This content analysis explored how concerns about safety were expressed in the planning process—did they adhere to a Vision Zero perspective or did they express a conventional mobility paradigm? What were the top concerns? Furthermore, did different stakeholder groups subscribe to Vision Zero more than others? Kelly Rodgers, a PhD student in the Toulan School of Urban Studies and Planning at Portland State University, explores paradigm conflicts around implementing vision zero in Portland.

Watch the interview with Kelly.

Kelly Rodgers is a PhD student in Urban Studies who is studying the use and influence of health indicators in transportation decision-making. She has been twice awarded the Dwight D. Eisenhower Transportation Fellowship and twice named a NITC Student Scholar. Kelly is also the Executive Director of Streetsmart, a non-profit organization developing an evidence-based platform that helps civic leaders integrate health, climate, and equity concerns into transportation. Kelly is the vice-chair of the Institute of Transportation Engineers' Health and Transportation Standing Committee, a member of the Transportation Research Board's Transportation and Public Health Committee, and is an advisory board member of the American Public Health Association's Center for Climate, Health, and Equity. Kelly also serves on the inaugural steering committee of Planning for Health Equity, Advocacy, and Leadership (PHEAL), a group of nearly 80 planning, public health, and other built environment practitioners who have written guiding principles that reaffirm health equity as a superior model for community planning. Kelly graduated with a Master in Landscape Architecture from the University of British Columbia and a Bachelor of Arts in Urban and Regional Planning from Miami University.

Photo by Michael Lander

Understanding Economic and Business Impacts of Street Improvements for Bicycle and Pedestrian Mobility - A Multi-City Multi-Approach Exploration

Jenny Liu, Portland State University


Authored by PeopleForBikes

According to a new study released by Portland State University’s Transportation Research and Education Center in Oregon, bicycle lanes and infrastructure can produce tangible economic benefits for cities.

The National Street Improvements Study, conducted by PSU in conjunction with PeopleForBikes and consulting firm Bennett Midland and funded in part by The Summit Foundation, researched the economic effects of bicycle infrastructure on 14 corridors across six cities — Portland, Seattle, San Francisco, Memphis, Minneapolis and Indianapolis. The study found that improvements such as bicycle and pedestrian infrastructure had either positive or non-significant impacts on the local economy as measured through sales and employment. 

For example, in 2012, bike lanes were installed on Central Avenue in Minneapolis by reducing the width of the travel lane and removing parking lanes. Retail employment increased by 12.64% — significantly higher than the 8.54% increase calculated in the control study area a few blocks away. The same corridor also recorded a dramatic 52.44% increase in food sales, which more than doubled the 22.46% increase in the control area. A protected bike lane along Broadway in Seattle that was completed in 2014 was accompanied by a significant 30.78% increase in food service employment compared to  2.49% and 16.17% increases in control areas.

“This study is an important resource to help cities make the case for building more bicycle infrastructure,” said Zoe Kircos, PeopleForBikes’ director of Grants and Partnerships. “PeopleForBikes knows that connected networks are key to encouraging more people to ride, and now the data shows that economic vitality often follows those investments. We’ll share these case studies far and wide, and encourage other communities to use this economic assessment guide to calculate the economic benefits of bike lanes on their own streets.”

While similar studies have been conducted in the past, notably by the New York City Department of Transportation in 2013 and the San Francisco Municipal Transportation Agency in 2014, the National Street Improvements Study was the first of its kind in incorporating these unified research methods across multiple corridors and cities. The findings refute assertions made by bike infrastructure critics that new lanes hurt adjacent businesses by making car access less convenient.

PeopleForBikes is hopeful that the results of this study can further our mission of making biking better for everyone, and be used nationwide by policymakers and city planners as an analytical framework for future infrastructure planning, particularly relating to the positive economic impacts and safety benefits of non-motorized transportation infrastructure like bike lanes. 

“There is tremendous potential to expand on what we learned in this research project to additional cities and corridors, and to provide policymakers with the opportunity to evaluate street improvement projects before implementation or to collect additional economic/business metrics before and after implementation,” said Jenny Liu, associate professor in the Toulan School of Urban Studies & Planning at PSU.

The study found that the food service businesses benefited most from the addition of bicycle and pedestrian infrastructure. Evidence of increased sales, employment and wages was observed in nearly all of the city corridors studied, even in cases in which a motor vehicle or parking lane was removed to install a bike lane. 

Learn more in a free webinar Oct 6 presented by lead researcher Jenny Liu. You can download additional resources here, including

  • Summary Report
  • Street Improvement Study Guidebook
  • Aggregated Trend Comparison Template
  • City Reports for Indianapolis
  • City Reports for Memphis
  • City Reports for Minneapolis
  • City Reports for Seattle
  • NITC Final Report: Understanding Economic and Business Impacts of Street Improvements for Bicycle and Pedestrian Mobility

This research was funded in part by the National Institute for Transportation and Communities (NITC). NITC is one of seven U.S. Department of Transportation national university transportation centers. NITC is a program of the Transportation Research and Education Center (TREC) at Portland State University. TREC is home to NITC, the Initiative for Bicycle and Pedestrian Innovation (IBPI), and other transportation programs.