Since 2013, local transportation activist group Better Block PDX has developed partnerships with organizations across the Portland Metro area. Most notable were the connections that emerged between the communities’ needs for creative transportation solutions and the expertise of Portland State University (PSU) transportation students.
That collaboration evolved into Better Block PSU, a pathway program led by PSU’s Transportation Research and Education Center that integrates tactical urbanism and placemaking into the engineering and planning curriculum at PSU. Most recently we shared an update on Re-Imagining a Safer Route to the César Chávez School, which advanced to the Spring 2021 engineering capstone.
We’re excited to announce the latest projects to have been accepted into the Better Block PSU pathway program:
- City of Independence Neighborhood Greenways: This project will help create a low-stress biking and walking network through Independence connecting local schools, businesses, and parks.
- Community Green Space for Parkrose: This project plans to create a pathway from the Parkrose neighborhood to the Columbia Slough to increase access to green space and community knowledge of the Slough.
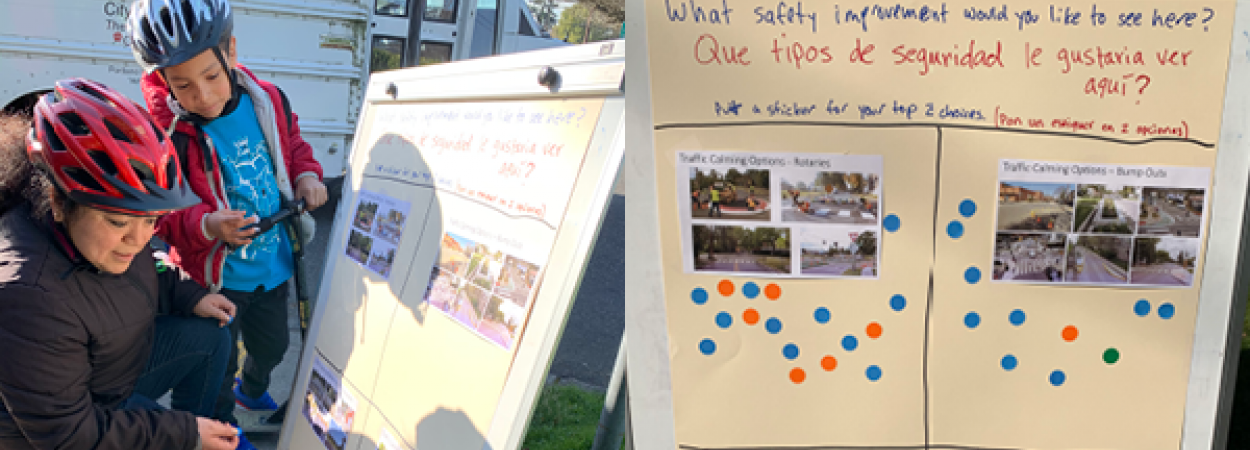
- Arleta Triangle Transformation: This project will transform a dangerous slipway into community space including a skate park, basketball court, and electric mobility hub, which have been identified as needs from the community.
Below we share summaries and excerpts from the proposals of the chosen projects for the PSU transportation classes. What aspects of the proposals are developed will evolve and change over time, depending upon the goals and constraints of the class. Later this year we’ll share an update on the progress and accomplishments of each project team.
City of Independence Neighborhood Greenways
THE OPPORTUNITY
The City of Independence, located in Polk County near Salem, Oregon, is updating its Transportation System Plan (June 2021). The City has articulated the need to improve pedestrian and bicycle routes, and identified a series of low-volume streets to serve as the basis for a new low-stress alternative transportation network. This project would be a logical next step following the update and would act as a pilot project to help the City think about how best to design and implement a small portion of the network.
This project would focus on three streets near historic downtown, offering the City the opportunity to connect four City-owned parks (including one facility that is currently undeveloped), three distinct neighborhoods, the area’s elementary school, two local head start facilities and the City of Independence’s downtown and riverfront. This historic neighborhood is served by a somewhat disconnected, gridded-street network. This disconnected network means that many of the through streets are primarily designed for cars, and the ability for individuals to walk or roll through the area is limited (especially for younger travelers).
The concept of these low-stress streets is broadly supported by the community, but design strategies to improve the routes are less well understood.
HOW TO MOVE FORWARD
Methods on how to make the low-stress streets inviting for all is exactly the question that this project would address. Routes such as Ash Street are straight and often have limited on-street parking (which encourages motorists to travel at higher speeds). Additionally, the road makes two 90-degree turns onto 4th near Independence Elementary, which when combined with the higher traffic volumes associated with school pick up and drop off, can contribute to an uncomfortable bike route. Traffic associated with Independence Elementary also makes the best connection from the school to downtown and Riverside Park unclear. The City has wrestled with whether the City should use B Street or C Street for the low-stress connection.
Students from Portland State University would help the City to think about the benefits and drawbacks of each idea.
WHAT DOES SUCCESS LOOK LIKE?
Is the project implementable? Have community residents, including those typically underrepresented had the opportunity to actively shape their community? Have relationships and opportunities for collaboration improved between the City and partner organizations because of work together on the project? Have the PSU students benefited from the experience? The project team has identified a multitude of success measures, and Fred Evander, City Planner for the City of Independence shares:
“The ultimate measure of the success is whether the project will promote walking, bicycling, and rolling. The City believes that the low-stress alternative transportation network pilot project will be transformative for Independence, Oregon.”
Community Green Space for Parkrose
THE OPPORTUNITY
Outer Sandy Blvd (between 99th and 121st avenues) is a narrow auto dominated strip often used as a bypass for Washington State residents seeking to avoid the I-205 freeway traffic. Located within the Historic Parkrose Neighborhood Prosperity Initiative district (HPR) and the Parkrose School District, it has few crossings and unimproved cross streets, and even fewer green elements to ease these harsh conditions. Trees have often been removed, citing a concern that they impeded car traffic visibility. Moreover, there is no community space or green space for the youth in this district.
HPR is developing a community plan, with the support of the City of Portland Bureau of Planning and Sustainability, that will document the needs and aspirations of Black and Brown local businesses, students, and families in the area. This planning work is funded through a grant from the Oregon Department of Transportation which includes a series of activities to engage and involve youth, residents, and Black, Indgenous, and People of Color (BIPOC) professionals working in the area.
This initiative will provide a Parkrose action plan: including transportation, access to green space, housing and anti-displacement, job navigation and home-based business technical assistance, and emergency preparedness.
HOW TO MOVE FORWARD
Better Block PSU can help bring several ideas to life, providing critical guidance for temporary transformation of an arterial road and/or collector streets as part of developing a conceptual route to the Columbia Slough. There are select sites directly on Sandy Blvd (an ODOT facility) and off this main road that are strong candidates for the project to:
- Create community gathering spaces, as there are no defined public spaces where people can rest, meet, showcase art, and put their own neighborhood landmark along their path to the Columbia Slough.
- Design safer pedestrian infrastructure for marked mid-block crossings on Sandy Blvd where there are lengthy walking distances between signalized intersections.
- Design pop-up parks and seating areas to provide much needed relief from a concrete landscape dominated by vehicular traffic. Invite businesses to collaborate and visualize the possibilities for growing entrepreneurship, connectedness, and safety. Much of the available land on Sandy Blvd is privately owned and vacant or underutilized.
- Develop a concept of a route from the Sandy district to the Columbia Slough for a direct, walkable and accessible connection to nature for the City of Portland and other partners to invest in.
WHAT DOES SUCCESS LOOK LIKE?
“Success for this project means developing a process and guide to repeating the project demonstrations,” shares Seile Tekle, Executive Director of HPR, “This could mean multi-agency permitting, fundraising, and community participation that documents community strengths and ideas.” The hope is that through demonstrations, these improvements could eventually become permanent.
Parkrose is among Portland’s most diverse and low-income districts, with 47.7% of residents identifying as persons of color (Venture Portland 2017) and a household median income of $34,906, compared to the Portland city average of $61,532. (American Community Survey 2017)
“The project is for underserved BIPOC communities, particularly the youth,” emphasized Tekle. The project team will measure success in terms of the quality of BIPOC community engagement and deliverables for the community plan (in progress) such as locating outdoor spaces preferably with green elements in Parkrose for our diverse community members to find respite.
Arleta Triangle Transformation
THE OPPORTUNITY
SE 72nd & Woodstock is the current home of the Arleta Triangle Project (ATP) in Mt Scott-Arleta Neighborhood of Outer Southeast Portland. The slip lane here - a remnant of the Lents streetcar line that once ran through this part of town, is wider than the main thoroughfare and its design incentivizes careless driving, esp from high-speed motorists across two arterials.
This poses a significant safety hazard to bicyclists and pedestrians, cutting off access to a valuable neighborhood amenity, Mt Scott Park and Community Center and creates dangerous gaps in the sidewalk and bike lane network. There have been numerous automobile crashes at or adjacent to this site. The slip lane is fully paved with asphalt, curbs, no painted parking, and ineffective stop signs at either end.
In addition the safety hazards, the project team has heard from a strong need from their diverse community for more inclusive planning. Their Black neighbors have shared that they feel marginalized from public space by the removal of basketball hoops in parks. They have heard from transit-dependent neighbors that the lack of a TriMet bus on either SE 72nd or Woodstock through this part of town is a burden on them. The teen program at Mt Scott Community Center has endured through recent budget cycles, and the youth in the community are struggling with mental health and other issues due to the state of the world.
HOW TO MOVE FORWARD
In addition to safety improvements, the project team wants to create an inclusive skate park with a basketball hoop, as well as an electric mobility hub (scooter parking, bike share, etc.). The Arleta Triangle Transformation project could use this Better Block PSU phase as grounds for building relationships with younger neighbors and their families across languages, cultures, and abilities; including site signage in multiple languages; and centering the principle of inclusivity in all stakeholder processes and design. This also might entail creating set aside times for specific parts of the community (trans, femme/NB identifying, people with disabilities) to use the space exclusively, as well, to be determined by those community members.
- Continue fostering equitable neighborhoods and demonstrate that creating inviting, inclusive community spaces can help foster community connections, intercultural learning, and tolerance across differences.
- Support the youth, especially from non-dominant cultures, and help them feel more valued, confident, and connected.
- Improve traffic safety in the neighborhood, especially the arterials.
- Activate the Arleta Triangle and encourage neighbors to be involved in the creation, management, and ownership of the space.
WHAT DOES SUCCESS LOOK LIKE?
“Inclusion is a tool, process, and outcome, so at each step of the project we would want to focus on it,” shared project lead Sarah Ianorrone, Executive Director of the Street Trust. “It can be hard, because inclusion is both qualitative (demographic) and subjective (user experience).” The project team may want to consider starting from PBOT's existing Equity Matrix (GIS) as a framework and getting some benchmark data about participants in the Teen Program at the nearby Mt Scott Community Center. The proof will be in the process and use.
Ultimately, they know it’s been a success if people from all backgrounds and experiences love using the space and feel committed to its success. By engaging in this process, the team hopes to gain methodological support for project evaluation.
How Do I Get Involved?
Although the 2021 RFP is now closed, you can read the Better Block PDX Guide to Pop-Up Projects, join our mailing list, and learn more about Better Block PSU here.
We're also seeking three transportation professionals to volunteer as Better Block Technical Advisors. Although classes began April 1, 2021, we're still accepting inquiries on a rolling basis.