Portland State University students interested in a career in advancing biking and walking can find financial support through two active transportation scholarships from the Transportation Research and Education Center (TREC) at PSU. Since 2008, nineteen students have been awarded.
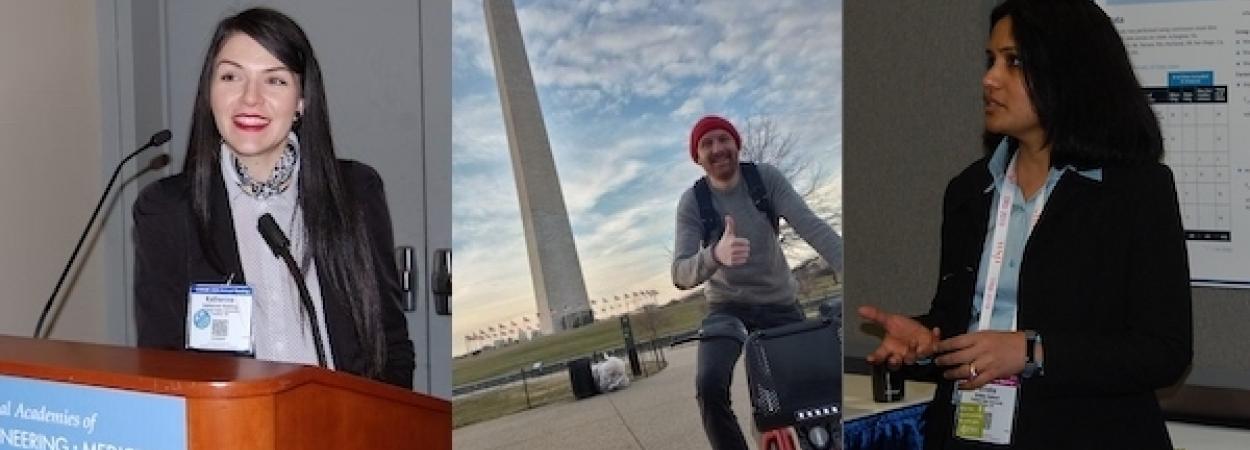
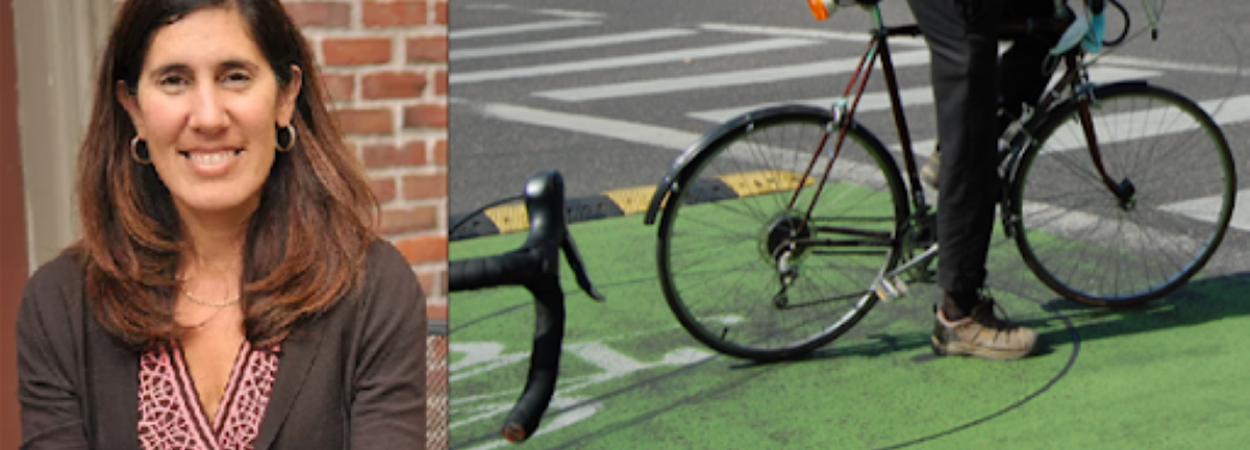
Mia Birk, the founding donor, is an independent consultant with 27 years of experience in helping to make cities more bicycle and pedestrian friendly. She served as the City of Portland's bicycle coordinator from 1993 to 1999, then as President and CEO of Alta Planning + Design until 2016. Her TED Talk makes the case for "Pedaling Towards a Healthier Planet," and her book, Joyride: Pedaling Toward a Healthier Planet, tells the story of her twenty-year crusade to integrate bicycling into daily life.
Mia has been involved in TREC’s Initiative for Bicycle and Pedestrian Innovation (IBPI) program for many years, and as an Adjunct Professor at PSU she wanted to support the future active transportation professionals in her community. Her former firm, Alta Planning + Design, provides funding and student support for the IBPI Active Transportation Scholarship and Internship. In 2015, Mia personally donated seed funding for a new endowed scholarship: IBPI Excellence in Active Transportation (donate here to support the future of the scholarship endowment).
We interviewed her to learn more of her story, and her motivation behind supporting the two Active Transportation Scholarships at PSU.
Why is supporting PSU’s active transportation students through this scholarship important to you?
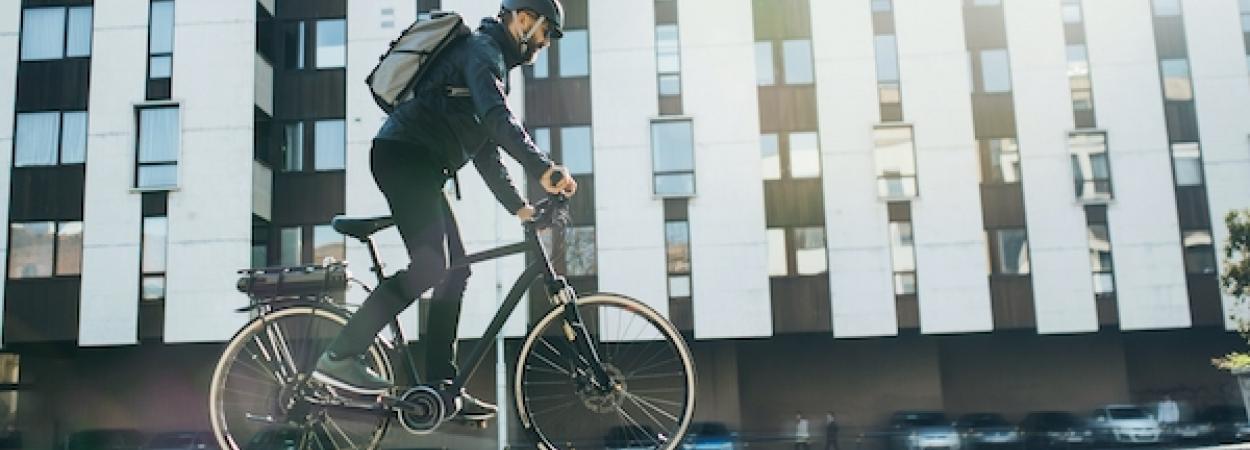
Active transportation has a positive impact on so many of the world's problems, and there aren't many things that have that potential for collective impact. In personal health, it helps us be more active in our daily lives. It has a positive impact on traffic congestion, noise pollution, air pollution, water pollution, and the socialization of humanity: instead of being isolated in metal boxes, we're able to see each other, talk to each other while we're out on the streets. I spent 27 years leading the field of active transportation and for me, functional societies are planned and designed around bicycling and walking at the core.
I am very passionate about providing an opportunity for students to learn this field, especially while it’s still relatively new and small. It’s still being incorporated into the structure of what we teach in universities, and I don't think there are a lot of opportunities to get a scholarship that's focused on active transportation. This scholarship serves students who really want to gear their life and career around active transportation.
What should universities be placing a greater focus on in educating the next generation of active transportation professionals?
For me, active transportation is a way to prioritize public infrastructure. Everything that we do in active transportation is incredibly effective from a cost standpoint. Our streets last longer, and our dollars are stretched further. I'm not anti-car; I recognize the important role that motor vehicles play in our toolkit of transportation options. I'm just pro having a really robust toolkit, where we can select the right mode of transportation for different trips, depending on what we're doing; where we live, work and play, and how we organize our society. So the overall impact of active transportation is multiplied by every type of benefit that it brings, on a personal and a societal level.
I spent four years in nonprofit work, six years in city government work. Later I spent 17 years in consulting, working with government agencies all across North America and beyond, and what I saw was that most university programs in planning and engineering focused education on the assumption that we are sitting around in cars with everybody driving.
So those students who get into transportation through university education have it reinforced by the people who are already in the industry: designing and building around motor vehicles. I think it's important that we break out of that cycle.
What is a need in the active transportation workforce that emerging professionals could bring to the table?
When I co-founded what became the Initiative for Bicycle and Pedestrian Innovation program, we identified several key approach points: there was teaching students, there was research that needed to be done, and there was continuing education for professionals and educators. And, cross-pollination across the different sectors of the industry. So IBPI became a platform to enable those teaching and training programs for change and innovation. Around that time I also started providing IBPI scholarships and internships through my firm, Alta Planning + Design. That grew out of teaching at Portland State University. One of my students, Mike Tresidder, who now works at the Spokane Transit Authority, basically said, ‘hey, would you hire me?’ And I thought, oh, that's kind of interesting. So we gave the internship a try. Another early participant in the internship program was Michael Rose. He's vice president at Alta now; he came and he stayed for the long haul. I learned that it was amazing for the students, to learn what we're doing; and it was amazing for us, because we got these smart, driven young people invested in active transportation. And you know, we could really build our whole workforce with that.
That was the foundation of my understanding that the whole cycle relates to students: what they learn, how they engage, how they're integrated with the world of transportation outside of PSU. Right off the bat, these students were very well rounded and really interested in how to make long-lasting change happen, and so I became really enamored with how we prepare those students for the workforce and be able to positively influence the places that they work in.
When you were a student, what helped you? What did you find valuable as career support?
The best investment I ever made in myself was in my own education. I would not have been successful if I hadn't. So I believe passionately in ensuring that students get to learn and use what they learn to have a positive impact on society. That's what the scholarship is all about to me. I was so moved by students that have said to me that even that small amount of money was important to them and that they were able to make it work financially.
I learned so much from our interns, they learned from us, so it was a cycle. And immediately they were able to apply what they learned to real-life situations all over the country. Then they brought interns in, and then they came and taught at Portland State, so it was like the gift that keeps giving. I see the scholarship as like planting seeds that grow beautiful, beautiful gardens.
Launched by Mia's initial seed donation, the Excellence in Active Transportation fund has also been supported in part by Alta Planning + Design, Kittleson, and a number of individual private donors.
Interested in supporting the next generation of active transportation scholars and professionals? Donate to the active transportation scholarship endowment here.
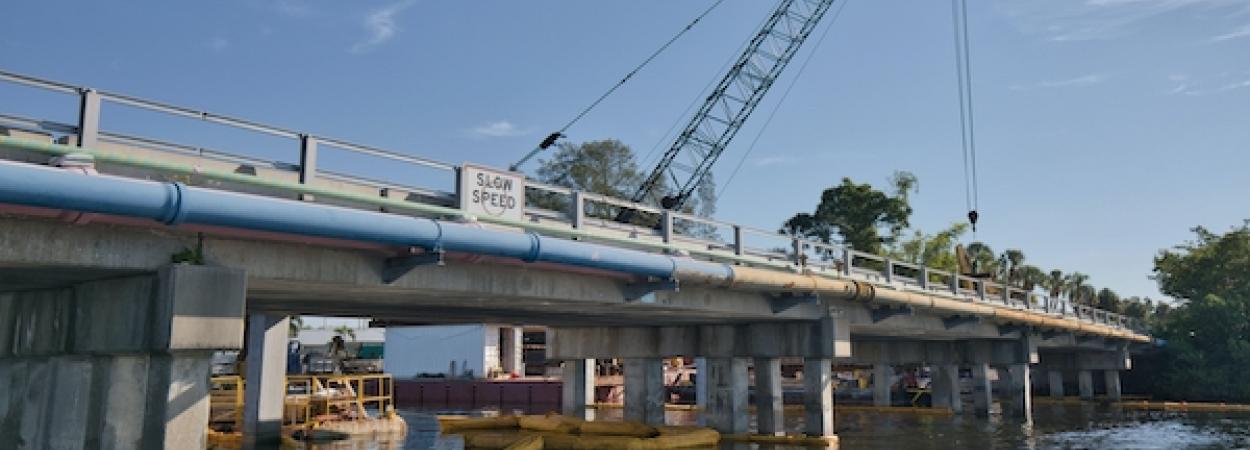
The Transportation Research and Education Center (TREC) at Portland State University is home to the National Institute for Transportation and Communities (NITC), the Initiative for Bicycle and Pedestrian Innovation (IBPI), and other transportation programs. TREC produces research and tools for transportation decision makers, develops K-12 curriculum to expand the diversity and capacity of the workforce, and engages students and professionals through education.